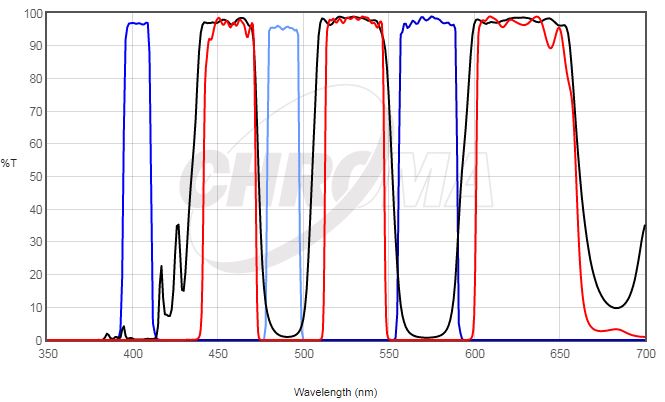
This set is also ideal as a tripleband filter set in FISH applications for simultaneous viewing of commercially available Aqua, Green and Red FISH probes.
69008 Spectrum
Filters
Type
69008x
EX
69008bs
BS
69008m
EM
69008 Spec
Typical Application(s) : Widefield Microscopy
Coating : Sputter/Hard Coated
Round excitation and emission filters mounted in anodized aluminum rings 2.3mm thick, up to 25mm in diameter (for standard sizes)
Rectangular dichroics up to 26x38mm, 1mm thick, to fit standard microscope manufacturer filter cubes (for standard sizes)
*** For filters larger than 25mm and dichroics larger than 26x38mm, please contact us for pricing.
NOTE: sets with multi-band excitation filters are not appropriate for imaging with a monochrome camera.
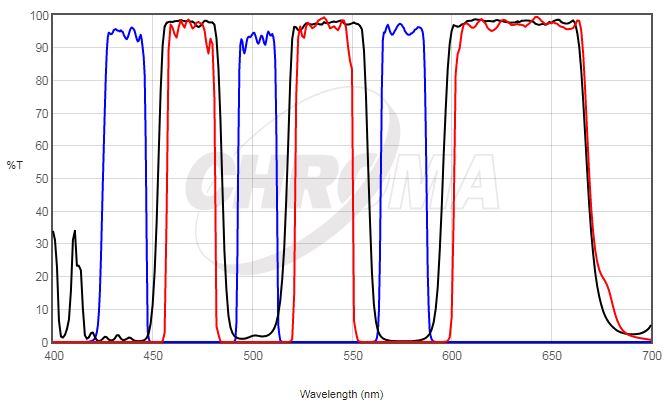
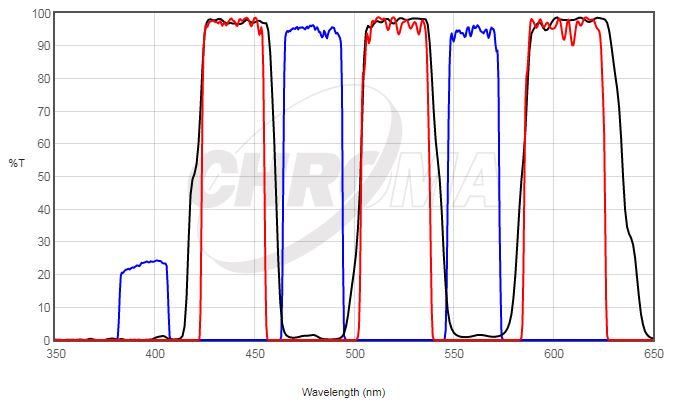
Triple band filter set ideal for simultaneous viewing of DAPI and commercially available Green and Red FISH probes. Attenuated level of DAPI excitaiton provides better balance of colors so that DAPI signal is not overwhelming.
69015 Spectrum
Filters
Type
69015x
EX
69015bs
BS
69015m
EM
69015 Spec
Typical Application(s) : Widefield Microscopy
Coating : Sputter/Hard Coated
Round excitation and emission filters mounted in anodized aluminum rings 2.3mm thick, up to 25mm in diameter (for standard sizes)
Rectangular dichroics up to 26x38mm, 1mm thick, to fit standard microscope manufacturer filter cubes (for standard sizes)
*** For filters larger than 25mm and dichroics larger than 26x38mm, please contact us for pricing.
NOTE: sets with multi-band excitation filters are not appropriate for imaging with a monochrome camera.
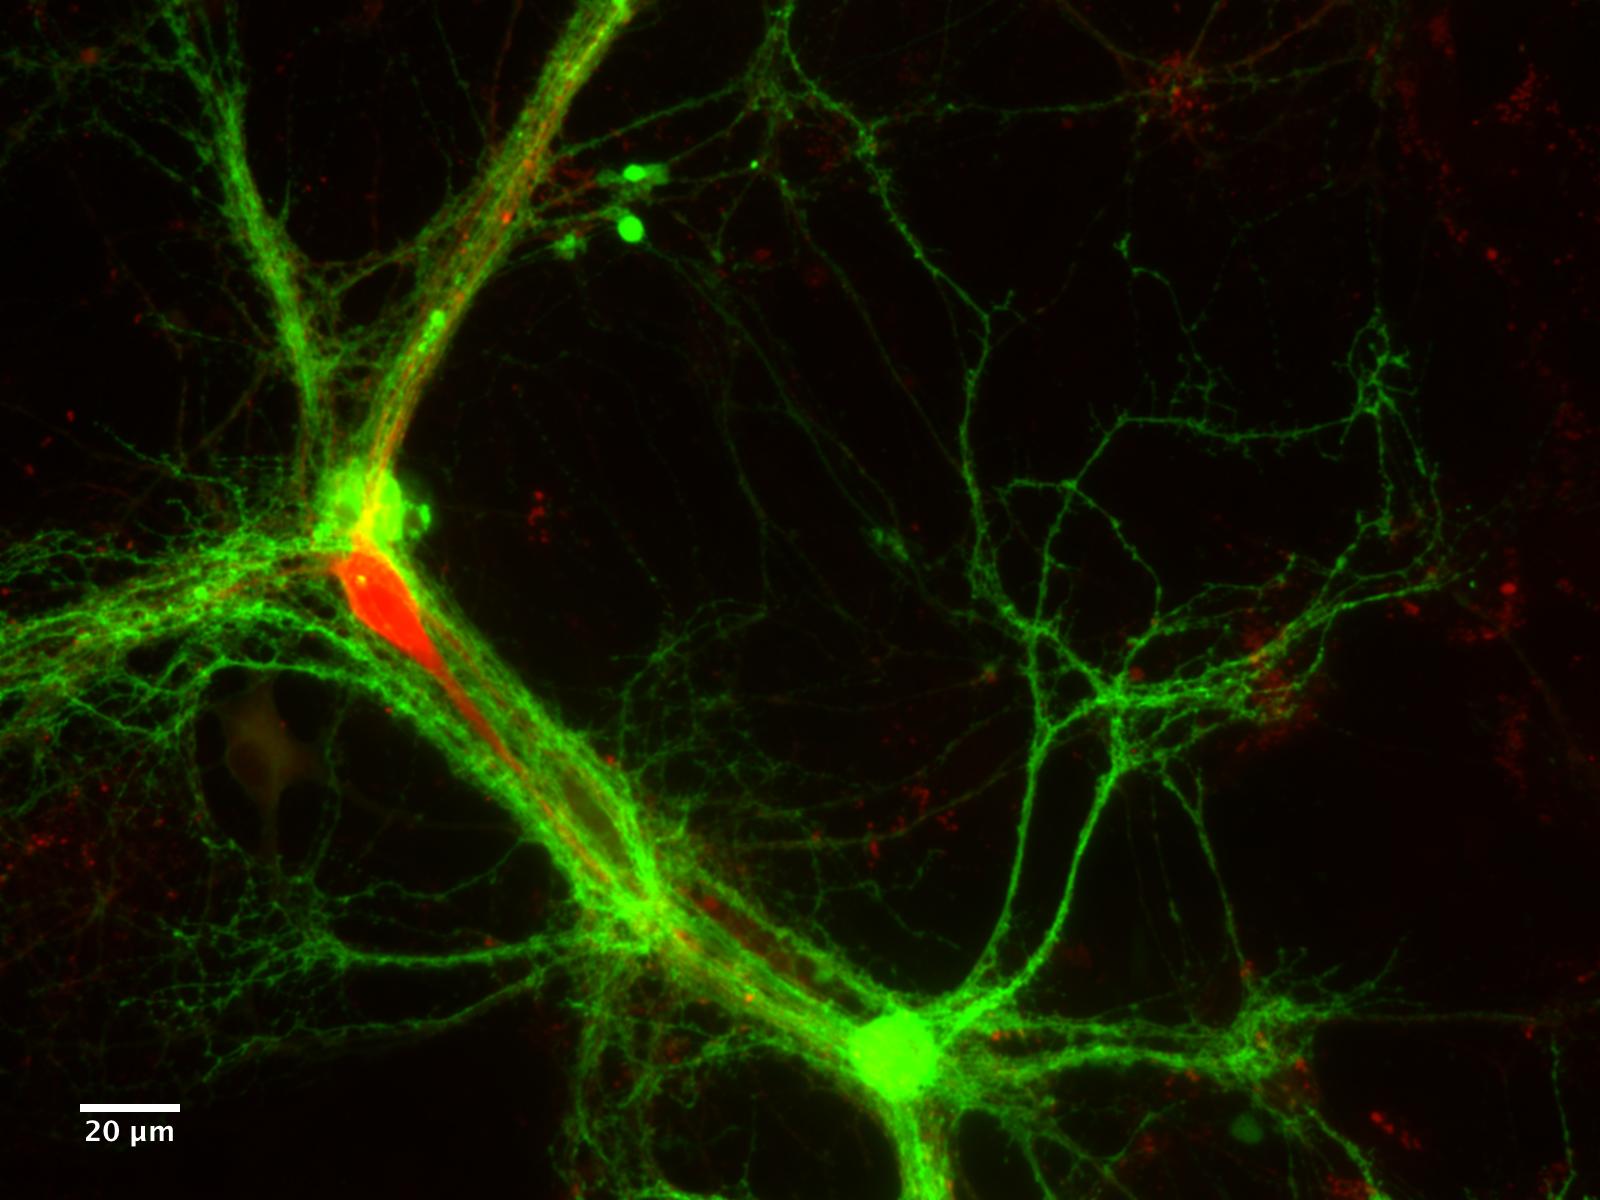
TdTomato-expressing Aspergillus fumigatus (amber) microcolony after 12 hours development on an A549 epithelial alveolar monolayer labelled with ConA-FITC (blue)
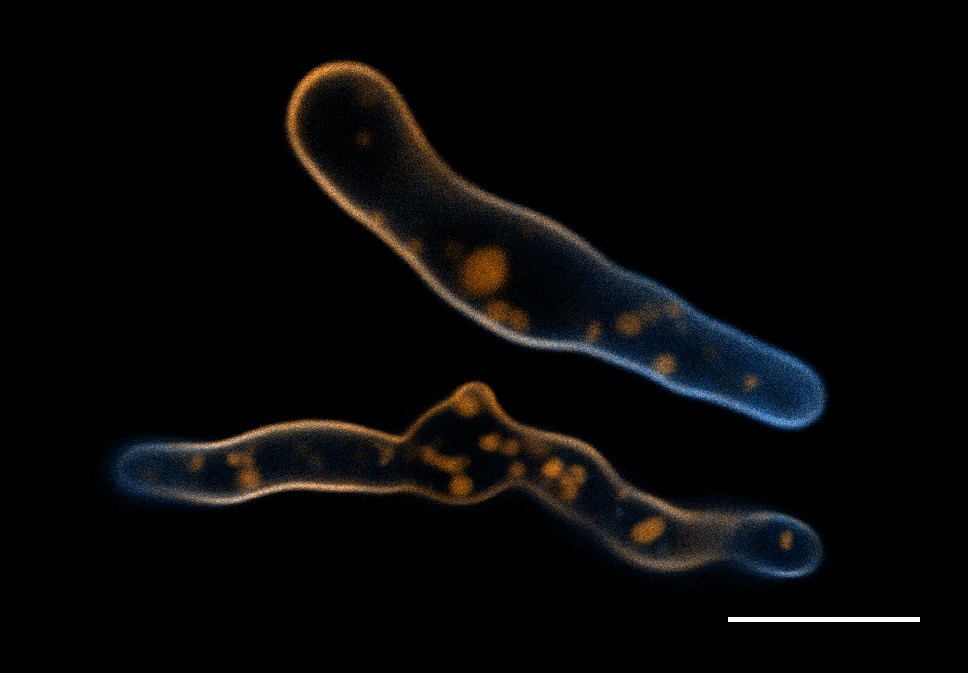
Aspergillus fumigatus germlings loaded with a synthetic cell membrane counterstain TMR-PAF96 (amber) and treated with fluorescent BODIPYcPAF26 anti-fungal peptide (cyan) to determine peptide’s localisation and mode of entry into the pathogen.
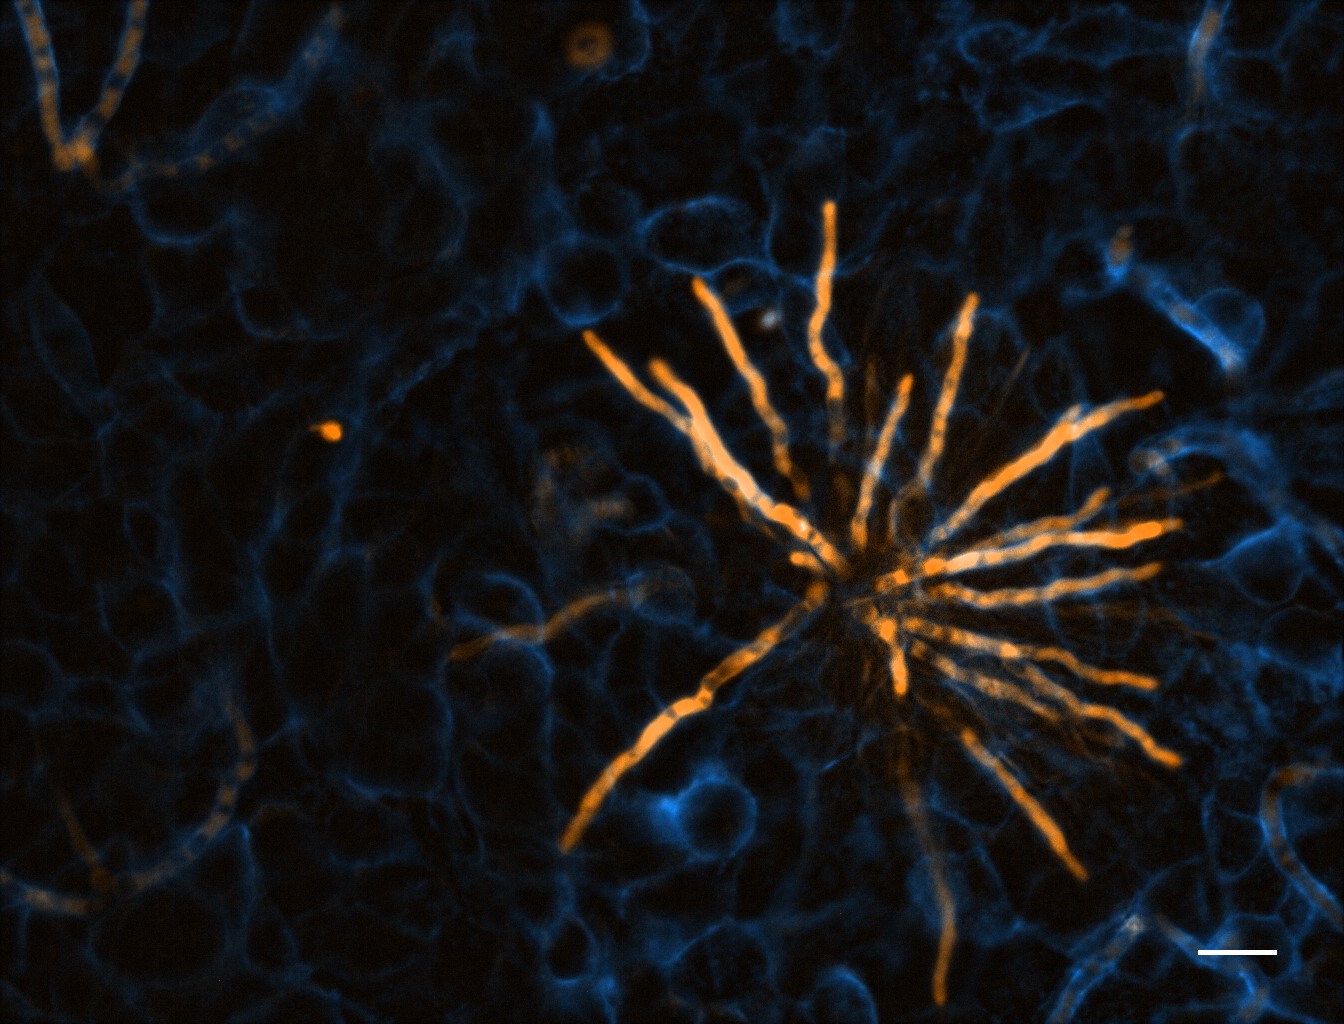
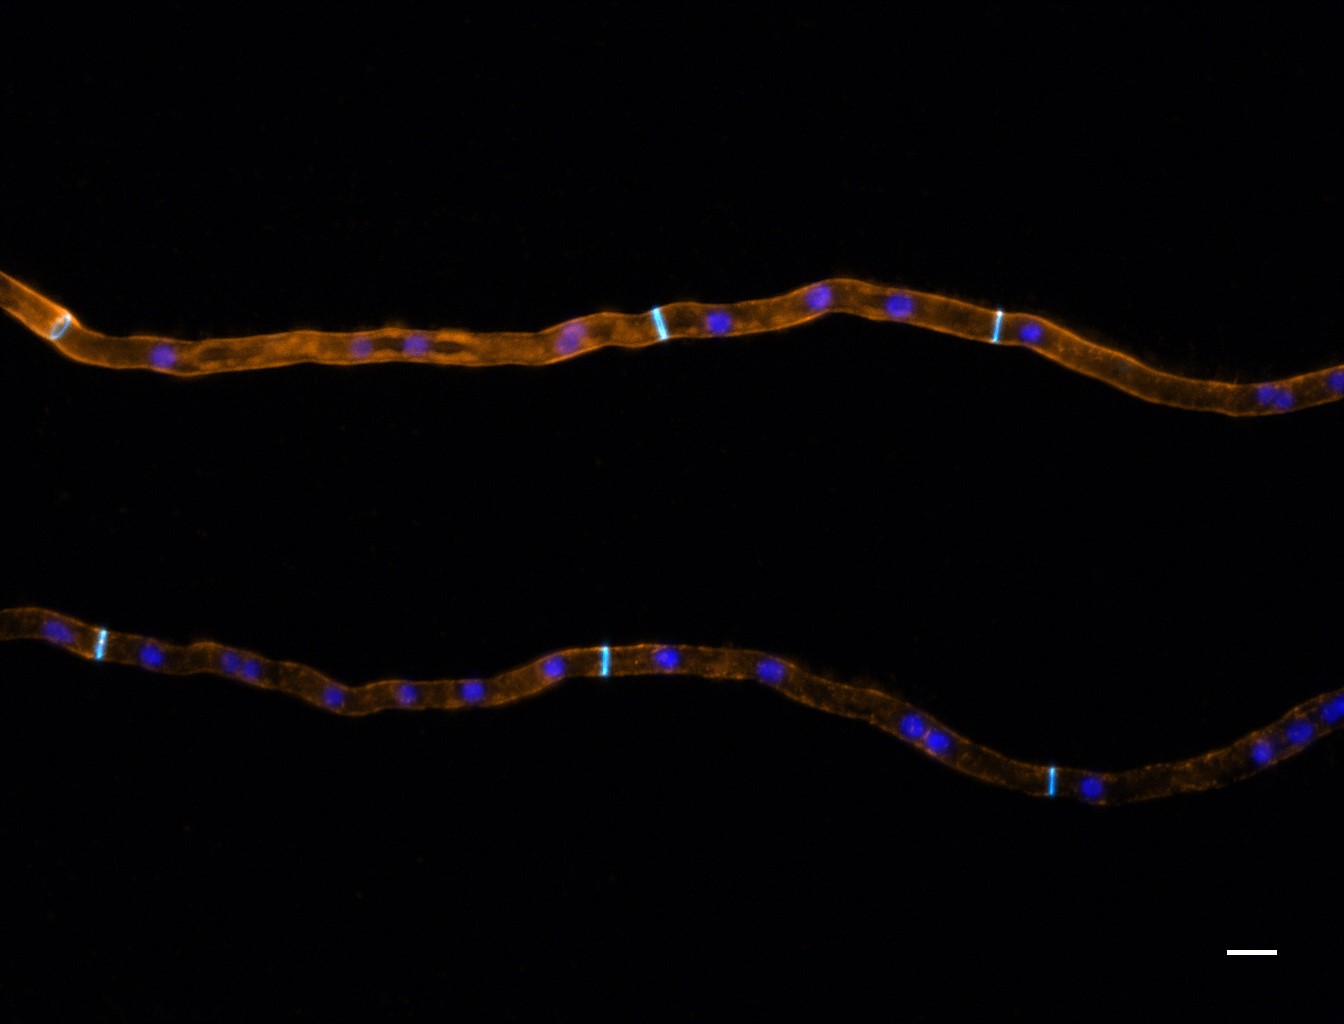
Neurospora crassa hyphal filaments treated with fluorescently labelled siRNA (amber) to determine its localisation, with respect to nuclei (blue) and the fungal cell wall and septa (cyan).
Ultrafast endocytosis at mouse hippocampal synapses taken with a CoolLED pE-2
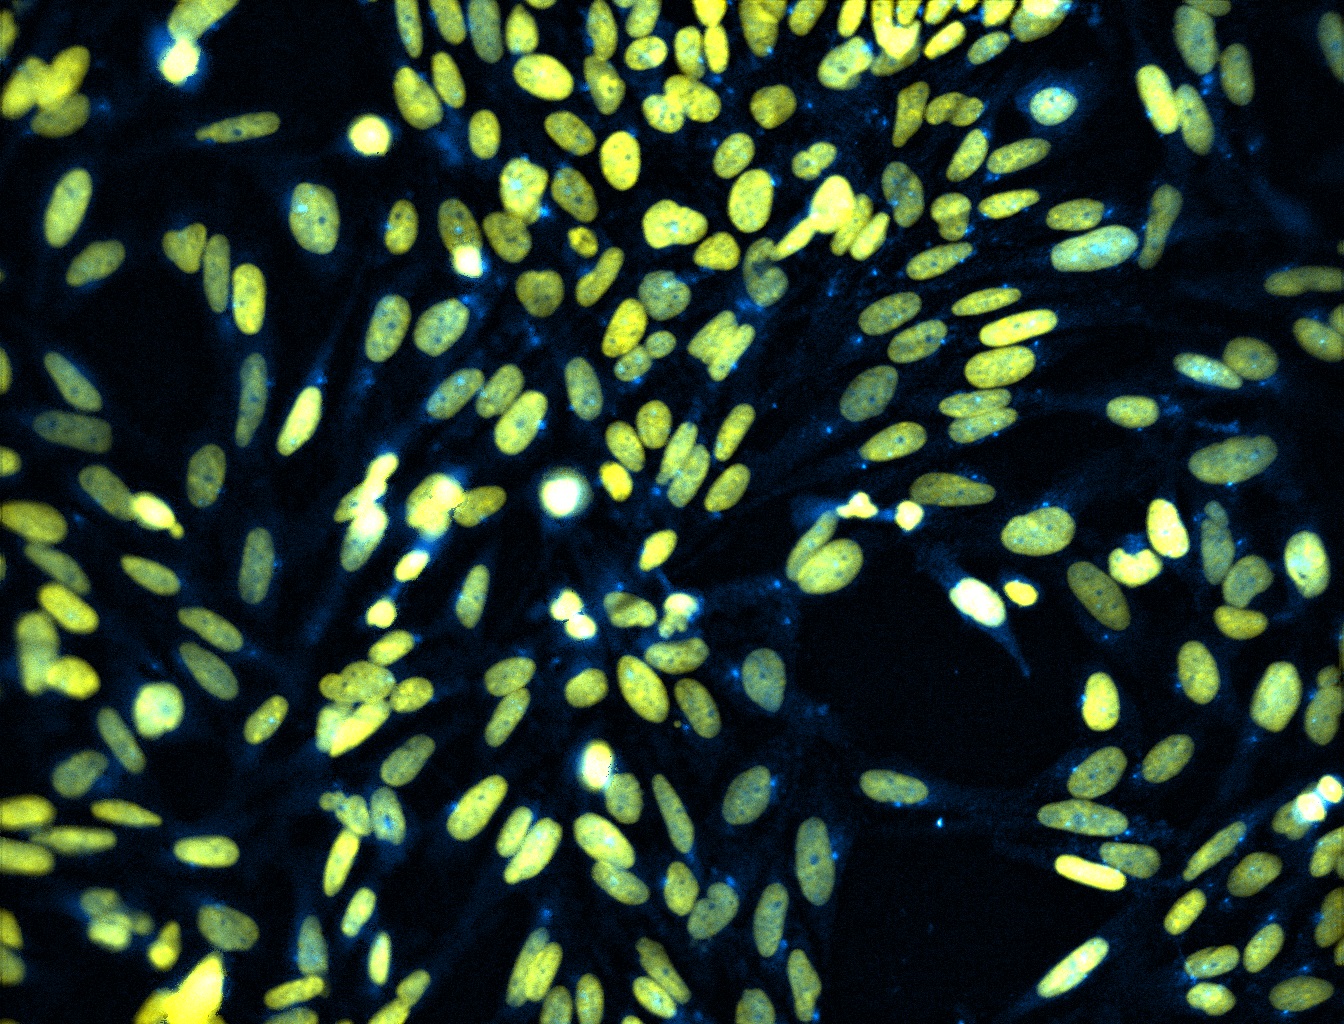
Antibody staining of a transcription factor localising in the nucleus
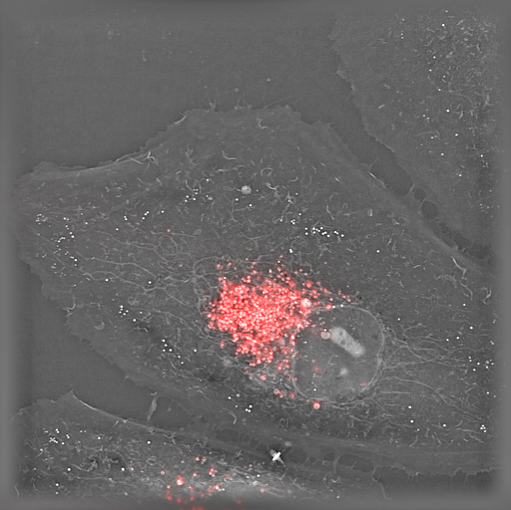
Live HeLa cells stained with lysosome marker imaged with Nanolive’s holotomographic technology.
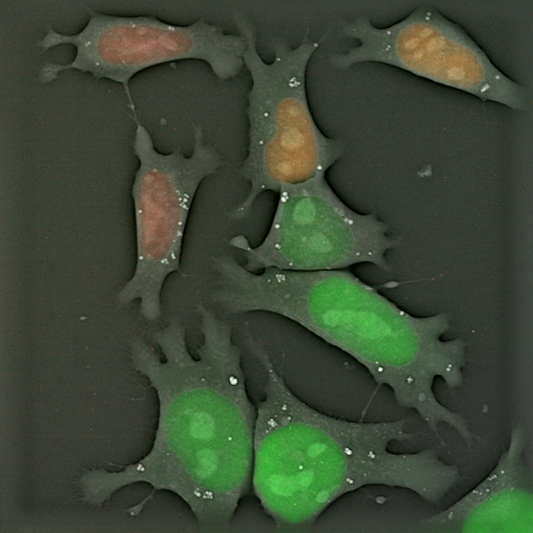
Live FUCCI mouse embryonic stem cells imaged with Nanolive’s holotomographic technology
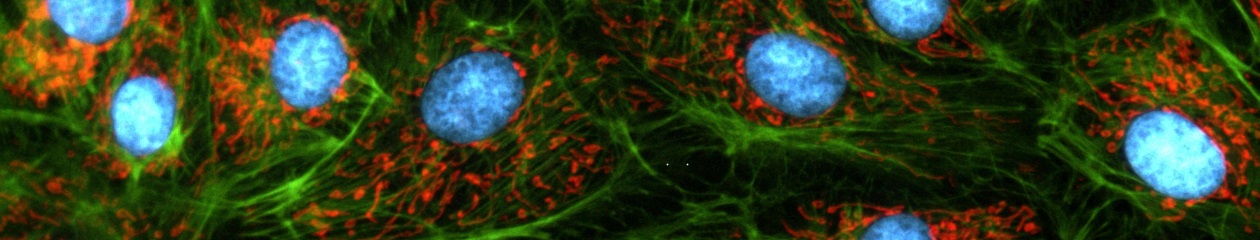
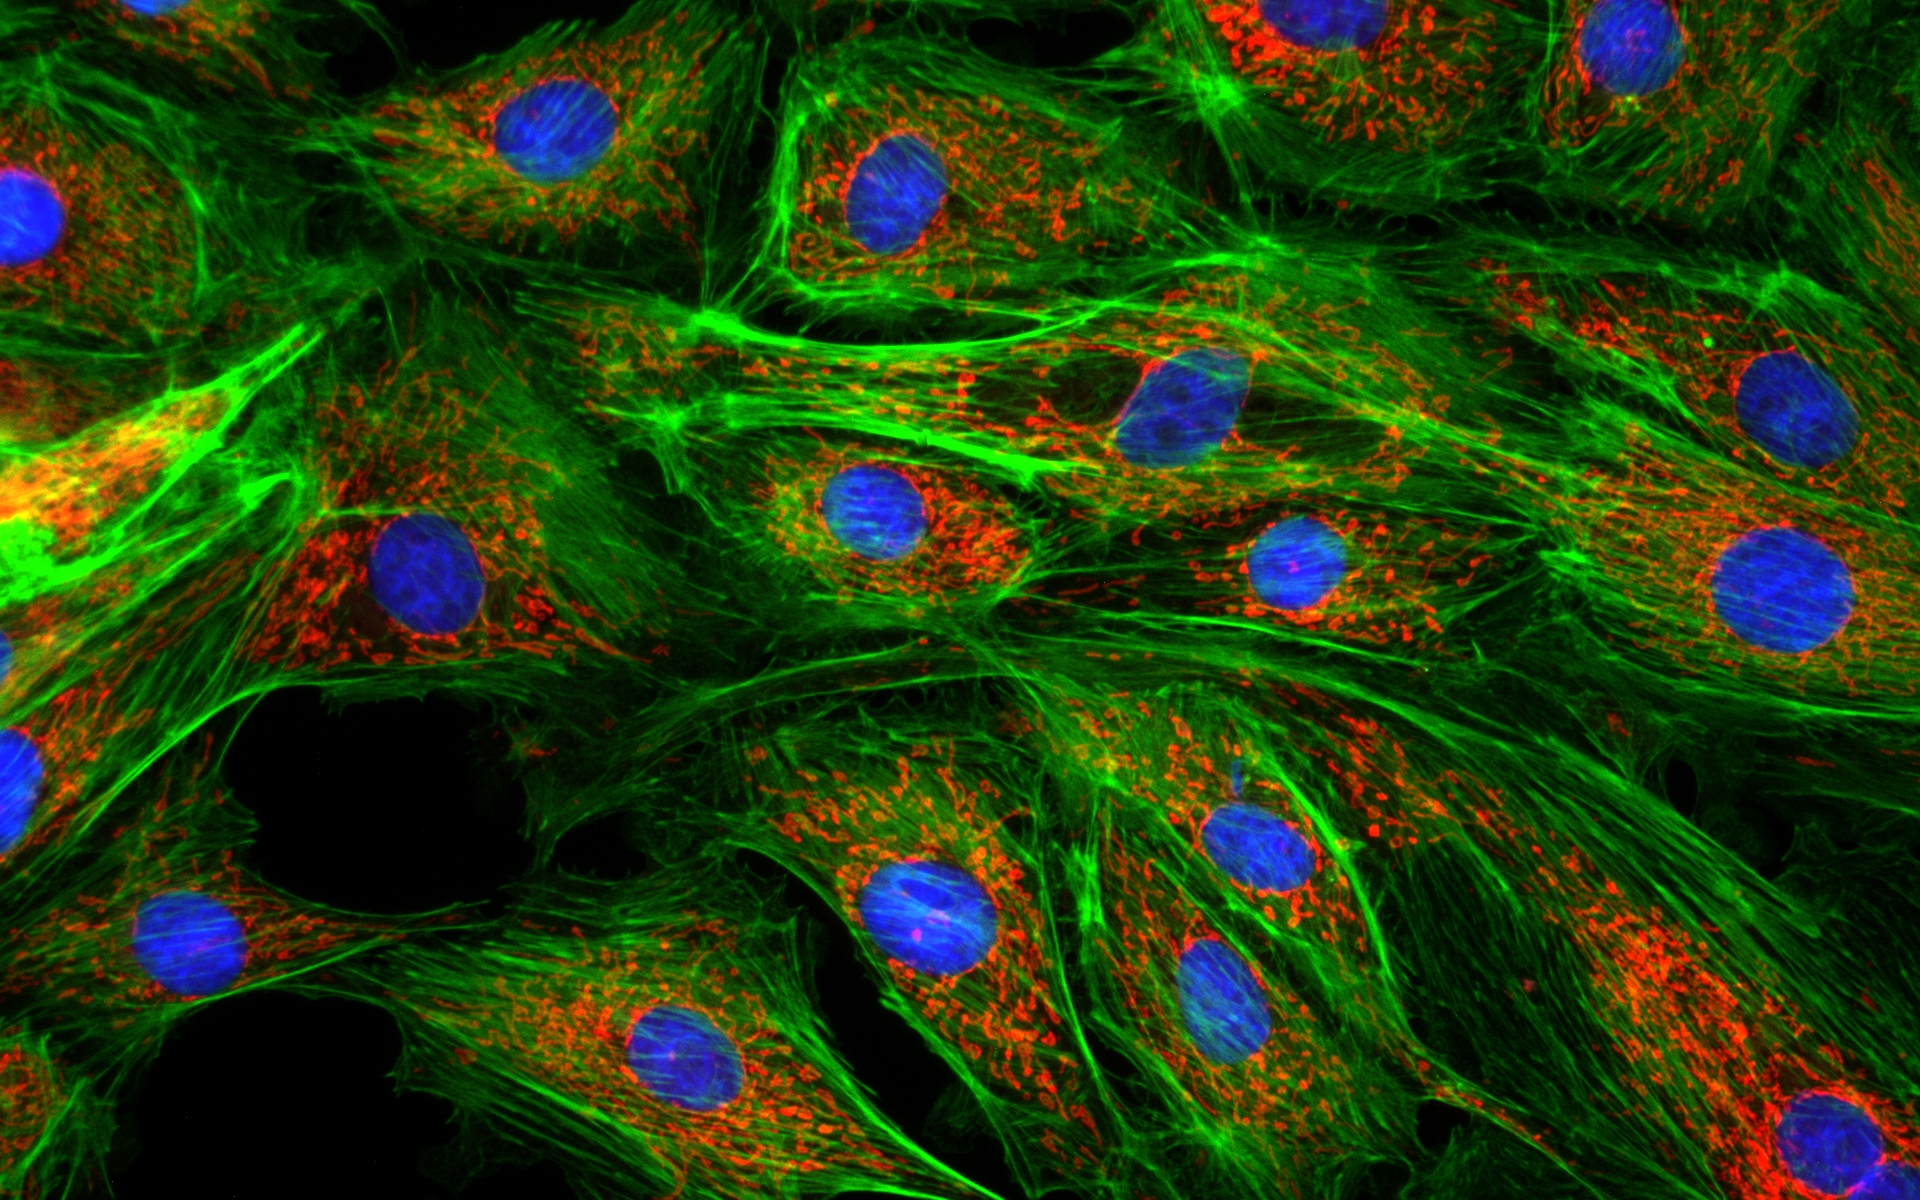
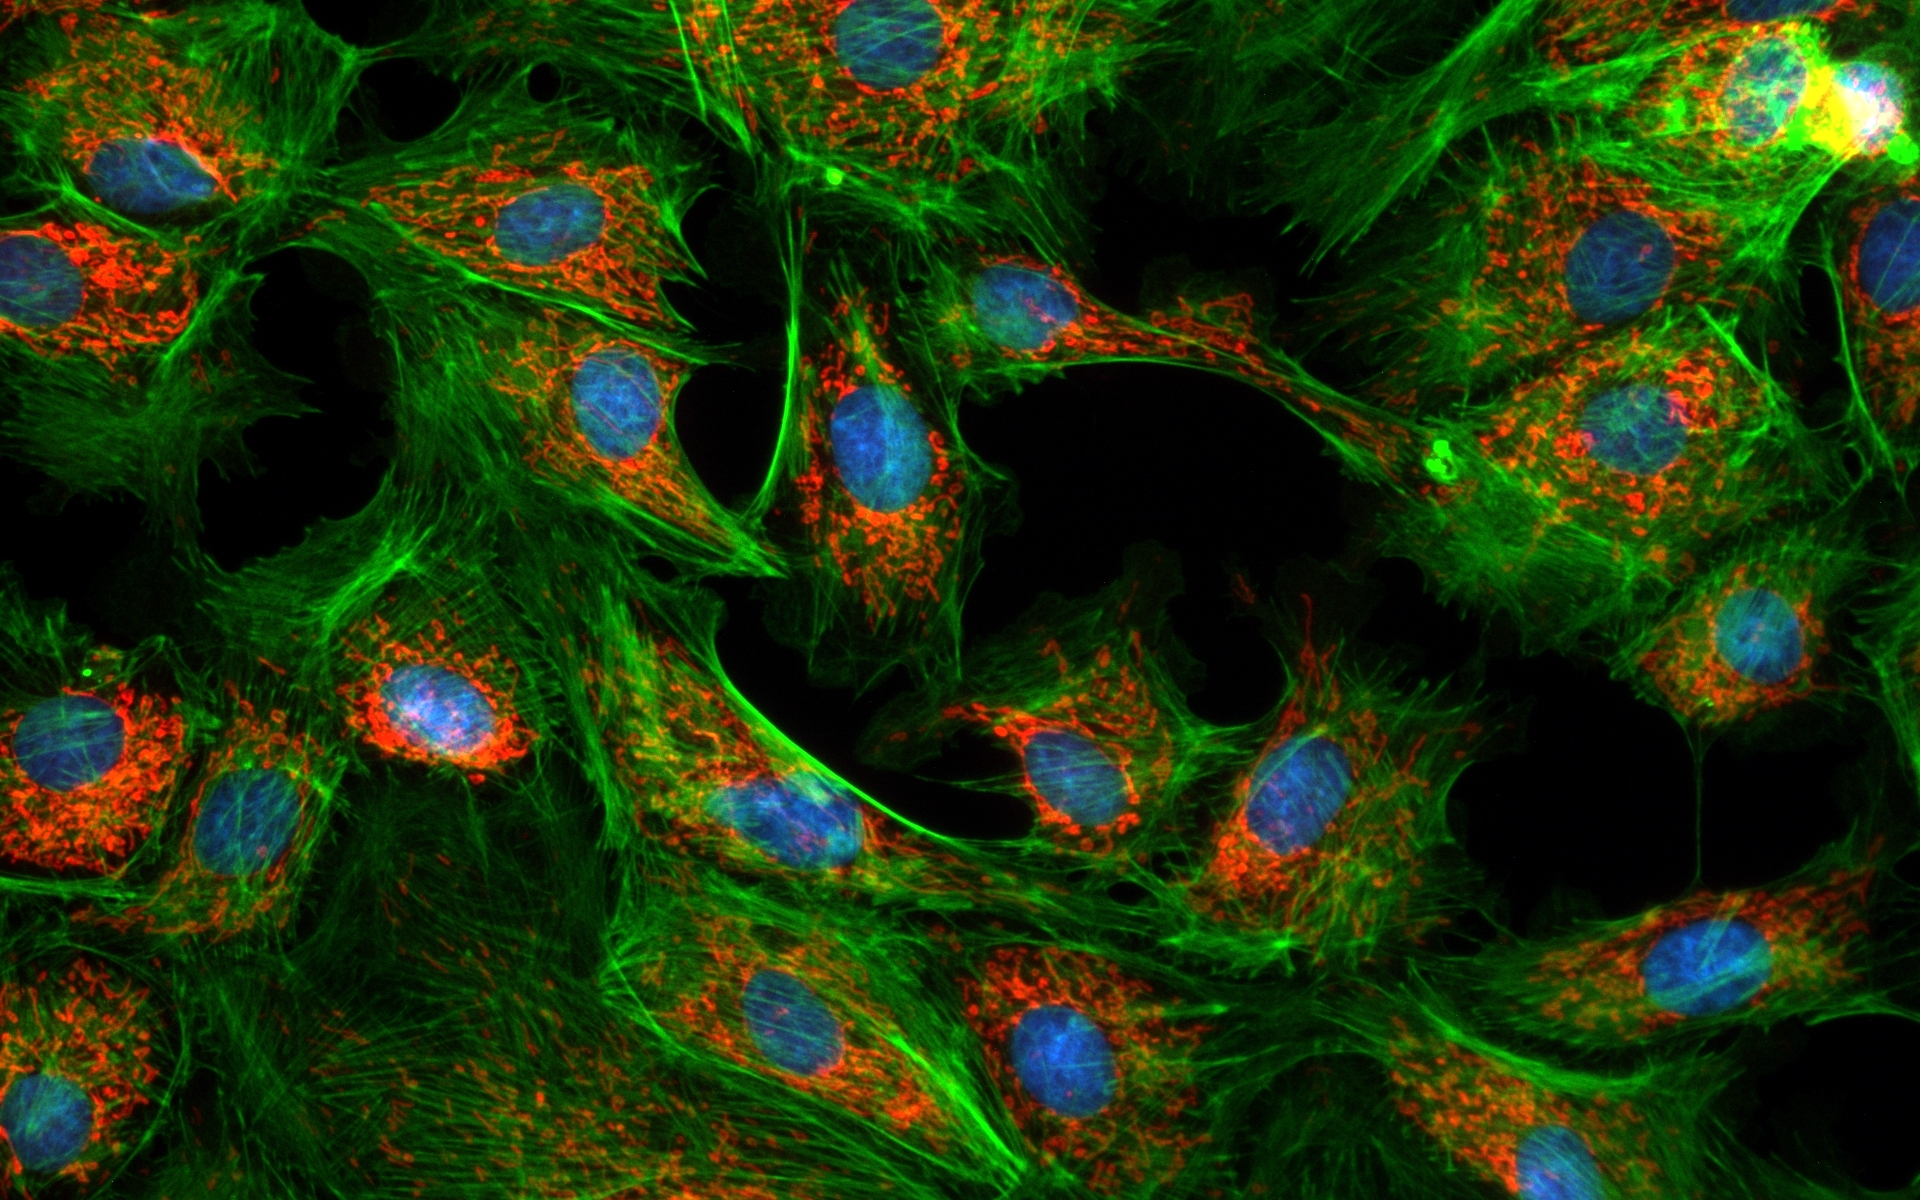
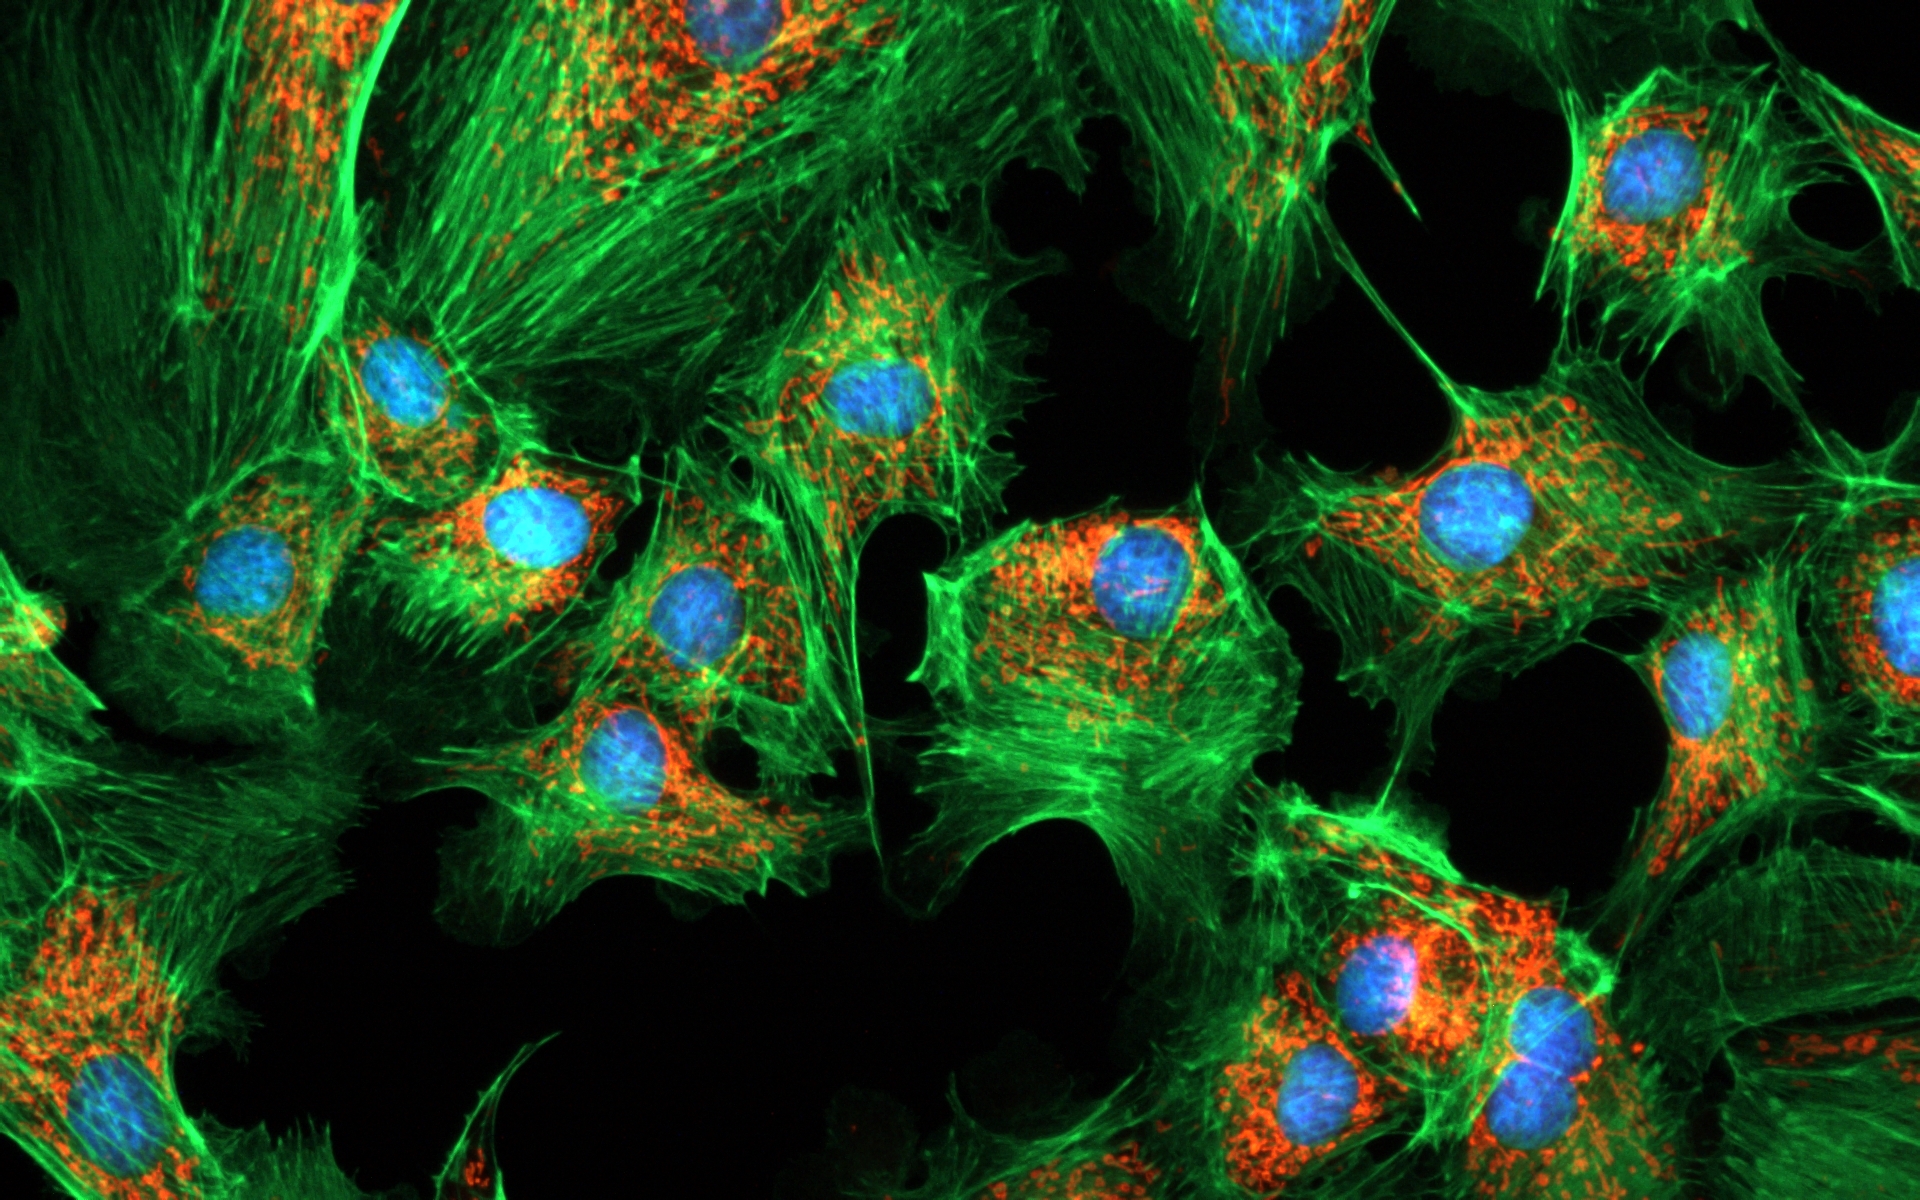
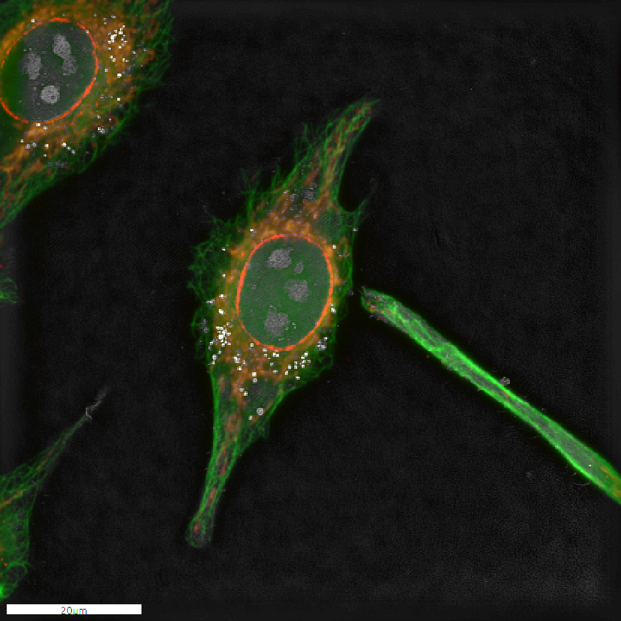
Fixed HeLa cells stained with Antibody for cytoskeleton (green), mitochondria (orange) and nuclear membrane(red). The whole cell was also imaged with Nanolive’s holotomographic technology and the four images were overlapped to create the overlay.
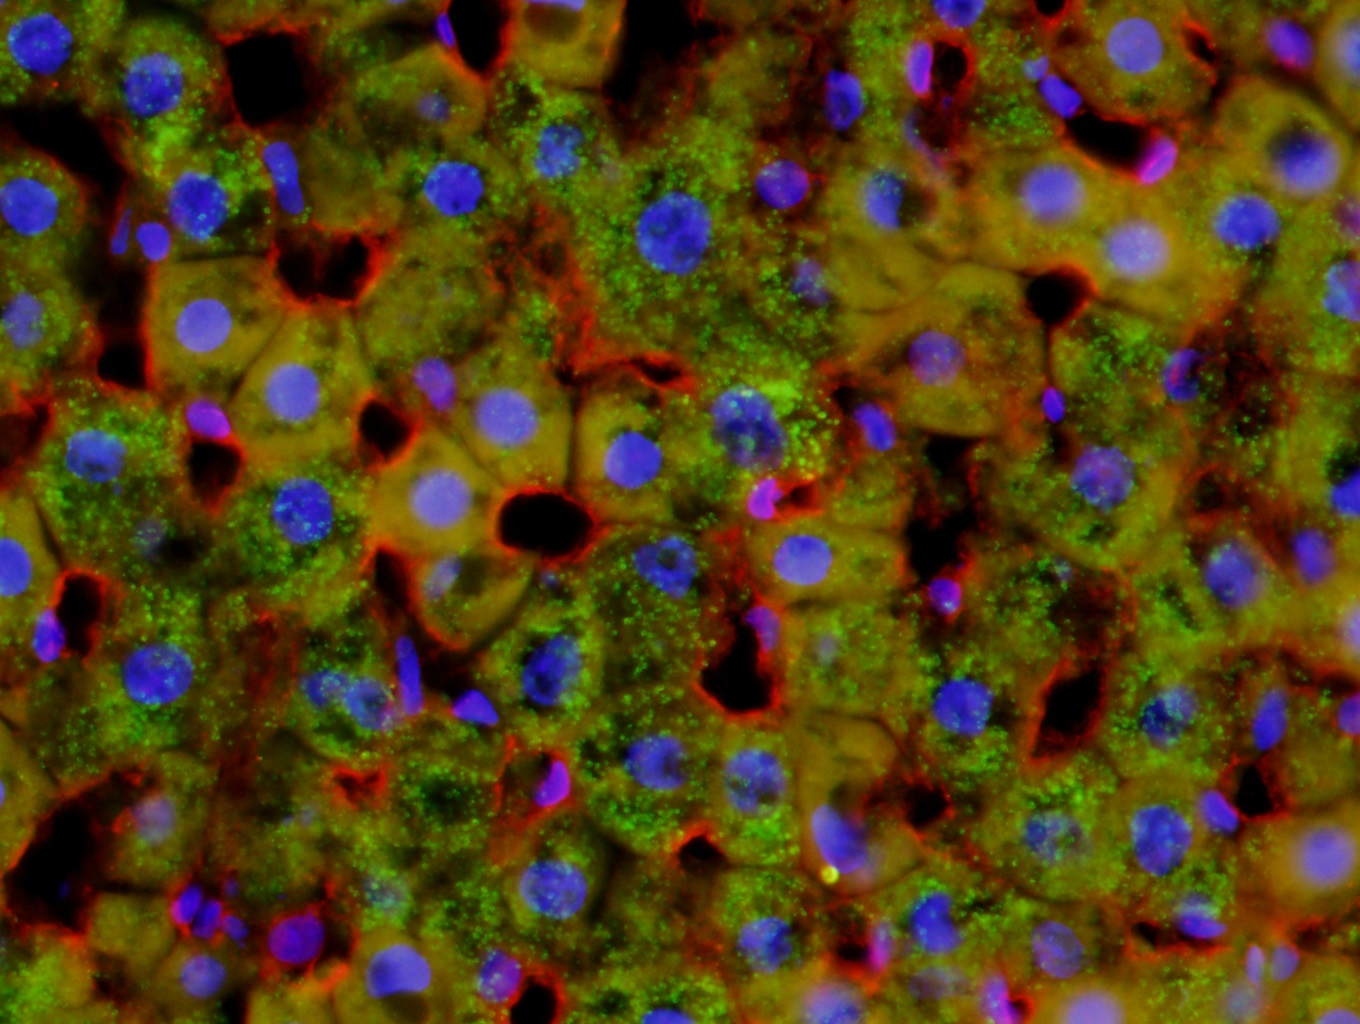
Fluorescent rat liver image taken using a CoolLED pE-300white, Olympus BX51 40x objective and a DP71 color camera
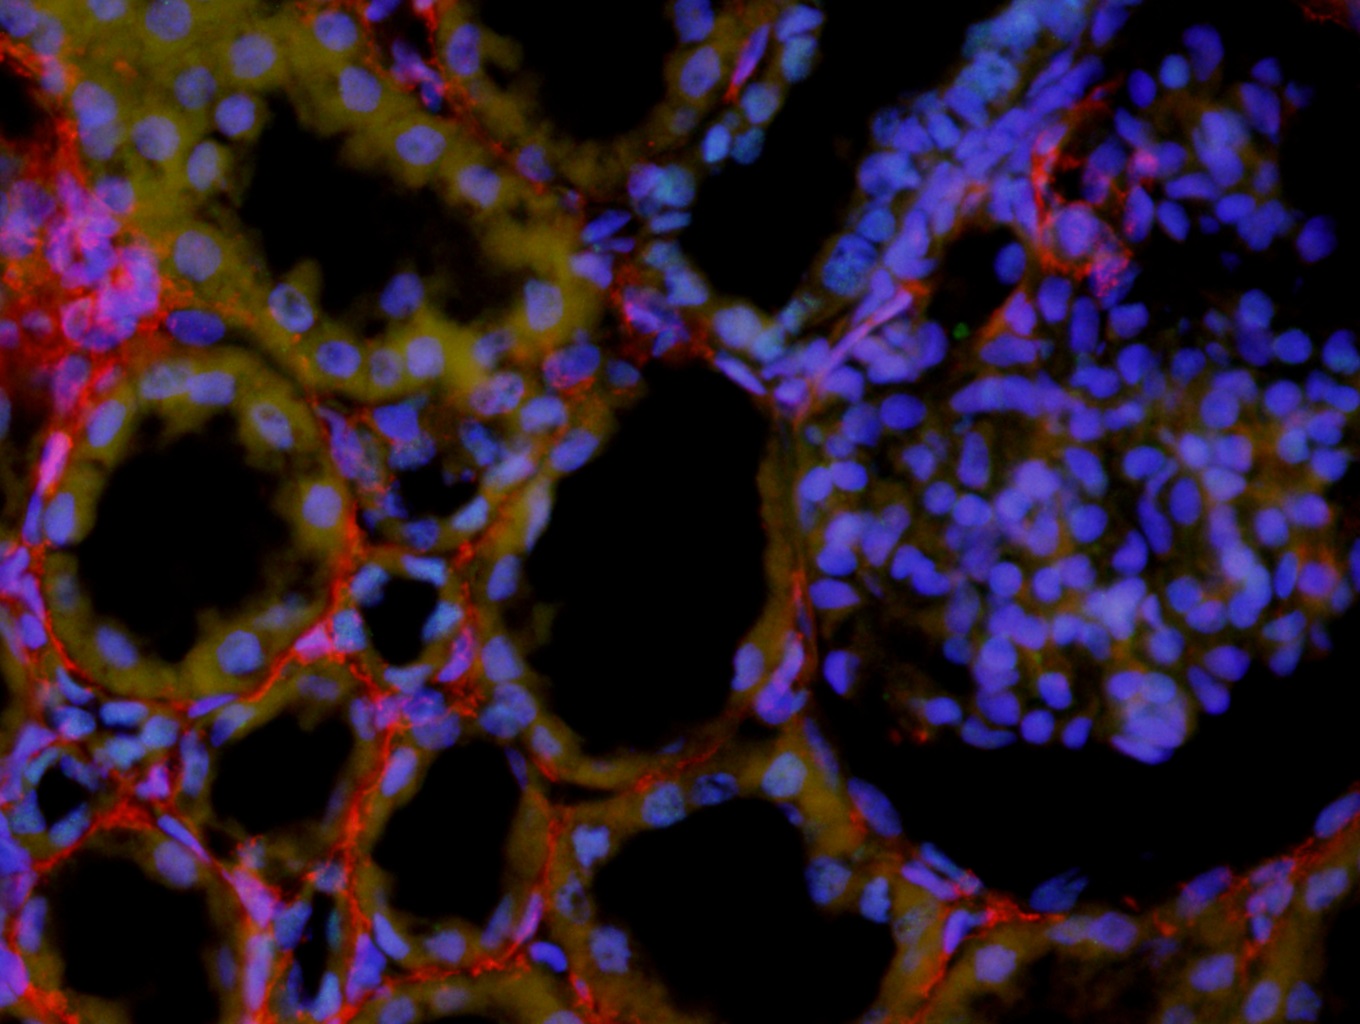
Fluorescent kidney image taken using a CoolLED pE-300white, Olympus BX51 40x objective and a DP71 color camera
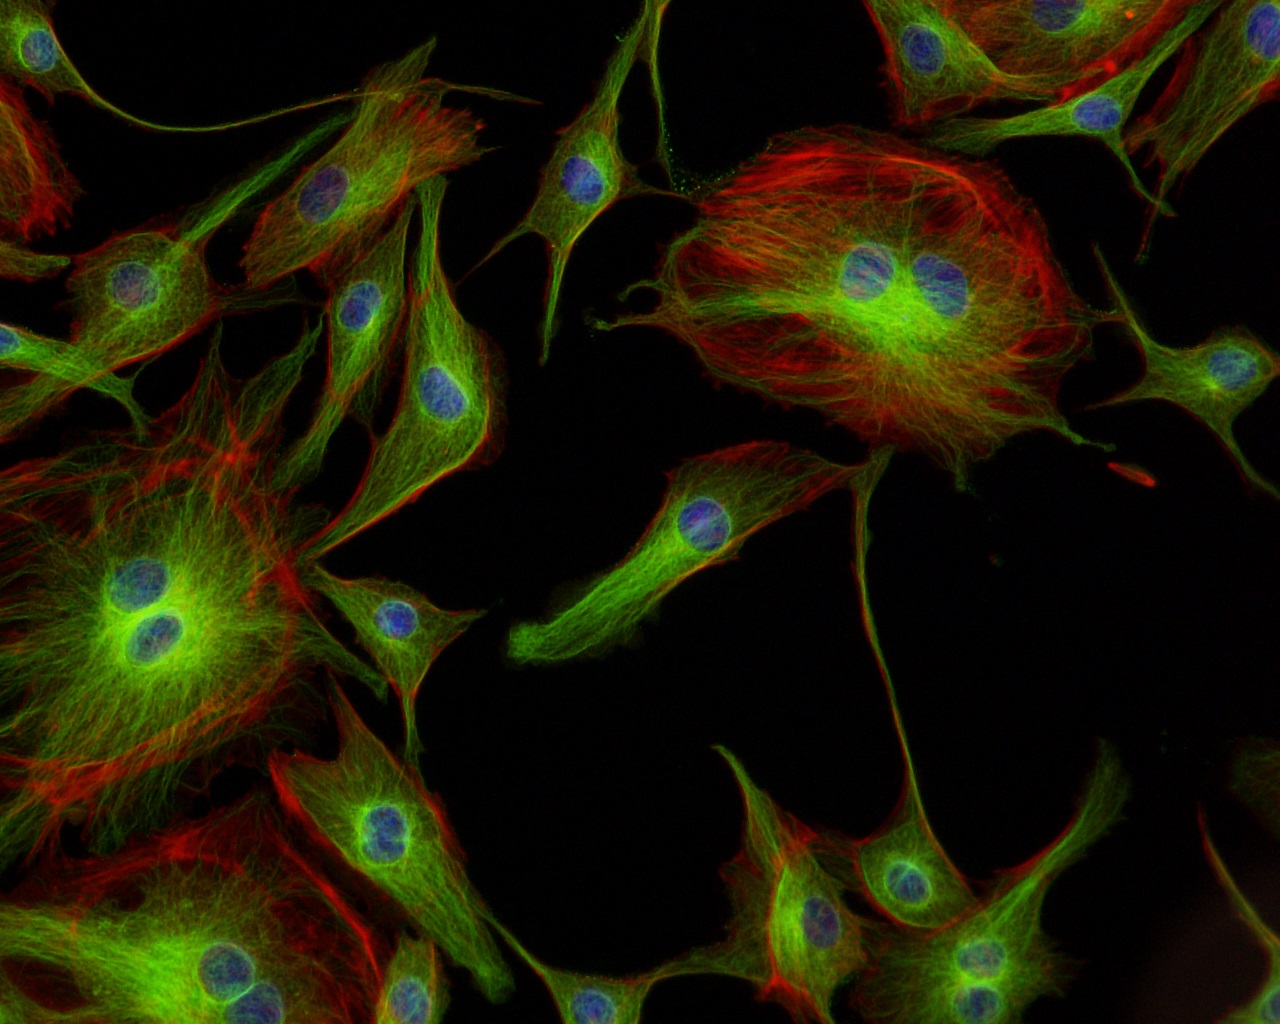
Fluorescent bovine pulmonary artery endothelial cells image taken using a CoolLED pE-300white, Nikon 20x objective and a black and white camera
Transmitted Podcarpus Elatus Leaf image taken using a CoolLED pE-100wht, Olympus BX51 20x objective and a DP71 color camera
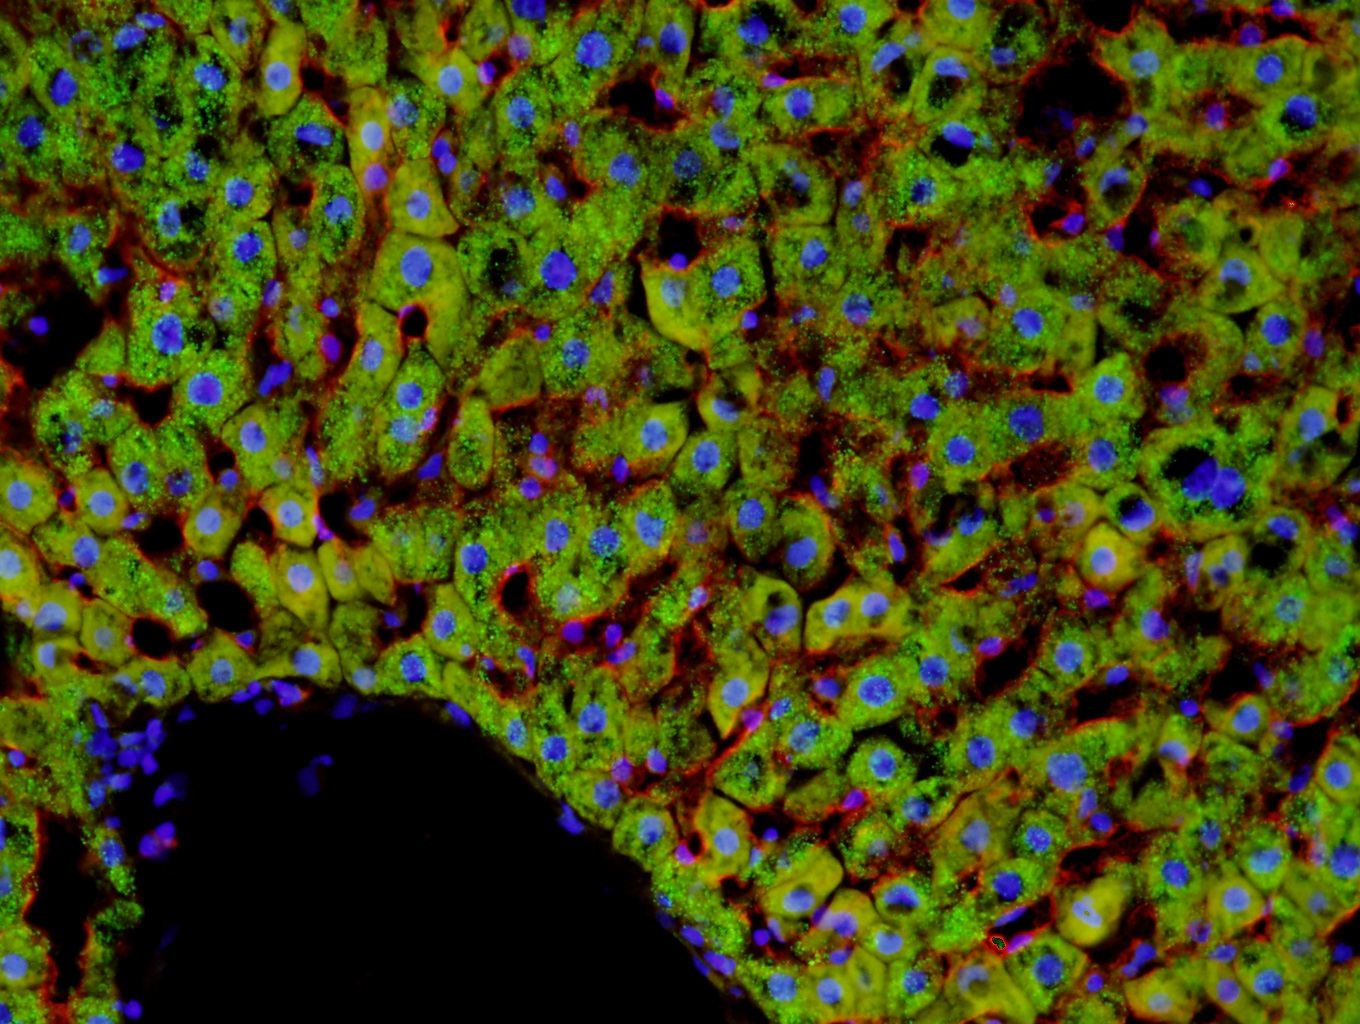
Fluorescent rat liver image taken using a CoolLED pE-300white, Olympus BX51 20x objective and a DP71 color camera
Fluorescent skin image taken using a CoolLED pE-300white, Olympus BX51 40x objective and a DP71 color camera
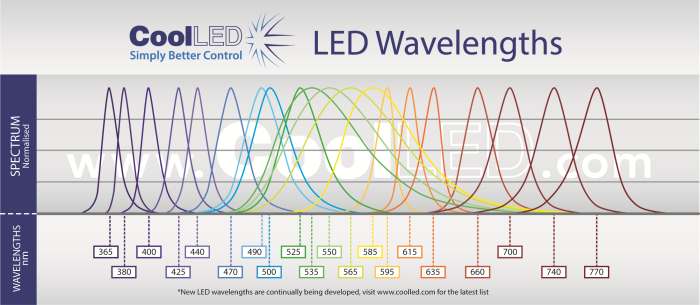
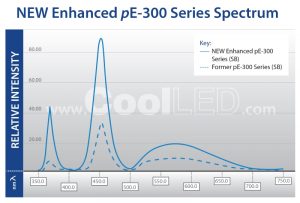
Broadest LED spectrum available: 365-770nm – replaces metal halide or mercury
Compatible with existing single and multi-band filter sets – no need to buy new filters
Instant on/off – no shutters required, no warm up or cool down
Simple to fit, simple to use – no alignment, a once only adjustment
Stable & repeatable – reliable and consistent results
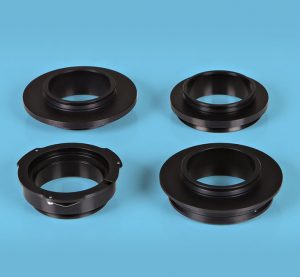
Wide range of microscope adaptors – fits most microscopes
Precise intensity control in 1% steps (0-100%) – no ND filters required
Excellent uniformity over field of view – fixed and stable, no alignment necessary
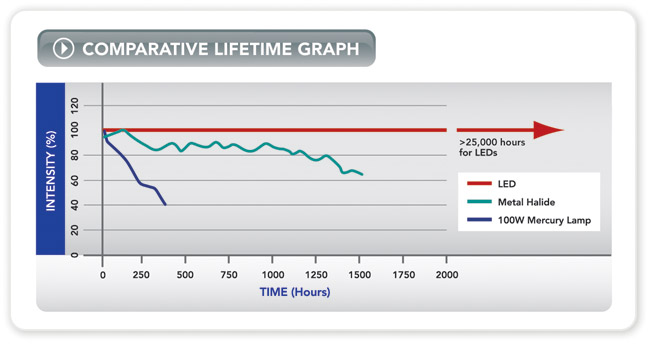
Long lifetime – expected to exceed 25,000 hours of operating time
CoolLED pE-100
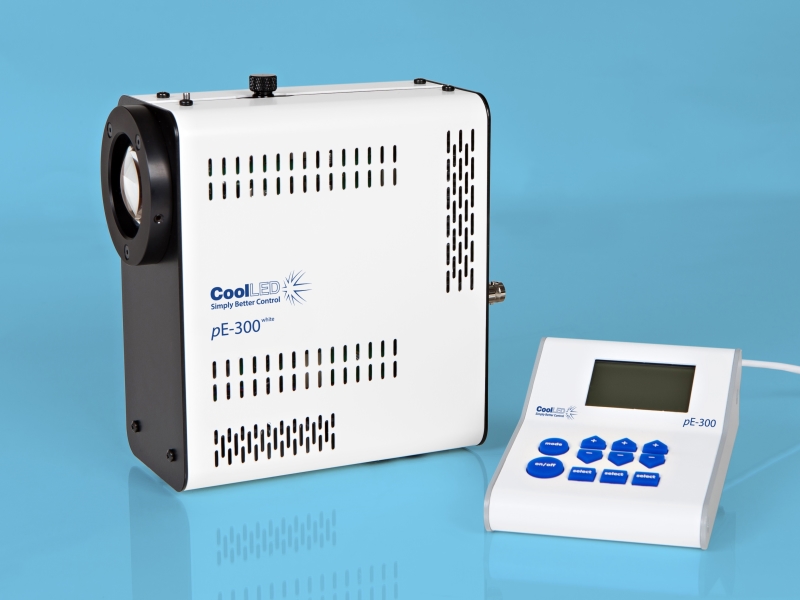
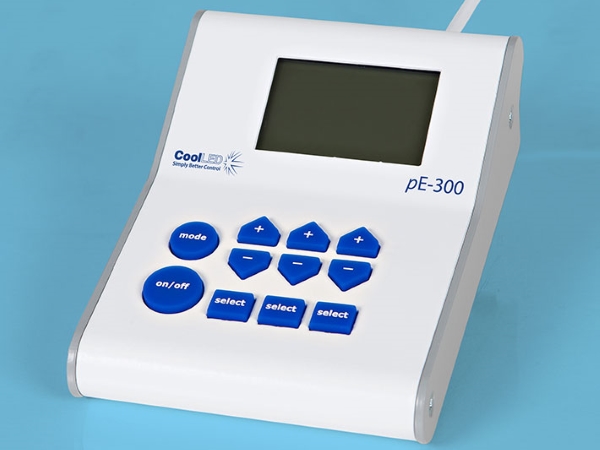
The pE-100 system has been developed for fluorescence applications requiring a single LED excitation wavelength. It is perfect for clinical applications such as routine screening (e.g. using Auramine for Tuberculosis), for research applications requiring precise intensity control and fast-switching, or for electrophysiology applications where light has to be delivered to a specific location. The user can select from 20 different LED wavelengths, ranging from the near-UV at 365nm to the near-IR at 770nm. The system comprises a pE-100 LED Light Source, control pod, and power supply.
There are three standard pE-100 configuration options:
Direct-fit
(pE-100) for connecting to a microscope (epi-port) by selecting from a range of microscope adaptors which covers all current and most older models. A simple once only adjustment will allow optimisation to the optical path of the microscope.
Liquid Light Guide
(pE-100light guide) with a fixed 3mm diameter, liquid light guideFiber
(pE-100fiber) with an SMA connection for accepting multimode fibers. The pE-100fiber has been designed with efficient coupling into a wide range of multimode fibers. The pE-100fiber also includes excitation filter holders.
Combining pE-100s:
Direct fit configuration
pE-100 units can be combined using the pE-Combiner for applications requiring a second LED wavelength with independent control and triggering.
Liquid light guide or multimode fiberusing a fixed two wavelength configuration can be specified. Two pE-100 Light Sources are combined, providing independent control and triggering. For further information go to the Downloads tab
The FLUOVIEW FV3000 series is designed to meet some of the most difficult challenges in modern science. Featuring the high sensitivity and speed required for live cell and tissue imaging, the FV3000 enables 2D-6D (x,y,z,t,λ,p) macro to micro imaging of cells, tissues, and small organisms. With an intuitive and adaptable user interface, the FV3000 supports complete workflows from image acquisition to processing and analysis. Particular attention has been paid to the needs of cell biology, cancer research, and stem cell research, and with two new upright configurations, the FV3000 is also poised to meet the needs of neuroscience, electrophysiology, and developmental biology.
High Sensitivity Multi-Channel Imaging
A Fully Spectral System with Sensitivity and Accuracy
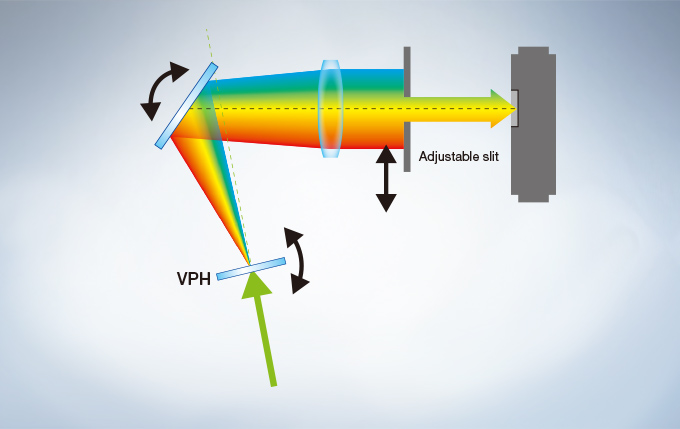
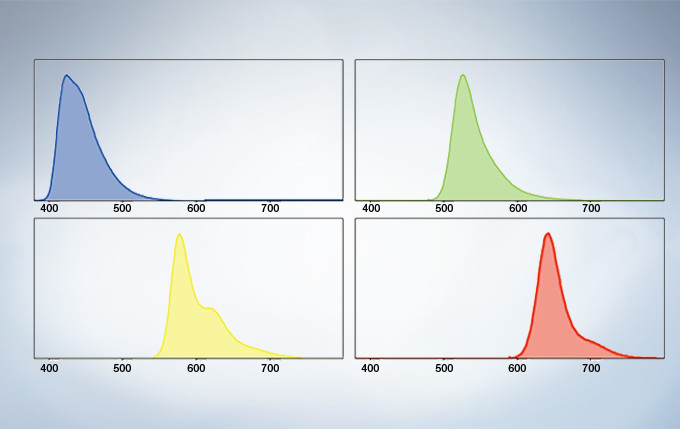
The FV3000 series employs Olympus’ TruSpectral detection technology. Based on patented* Volume Phase Hologram (VPH) transmission and an adjustable slit to control light, the spectral detection is highly efficient, enabling users to select the detection wavelength of each individual channel to 2 nm.
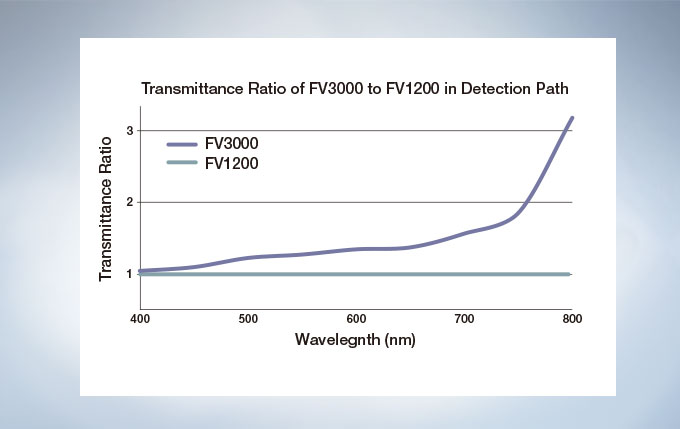
Efficient TruSpectral Detection System
The FV3000 is a fully spectral series of confocal microscope. TruSpectral detection delivers improved overall transmission and sensitivity. The high signal-to-noise ratio results in excellent multi-color confocal imaging capabilities.
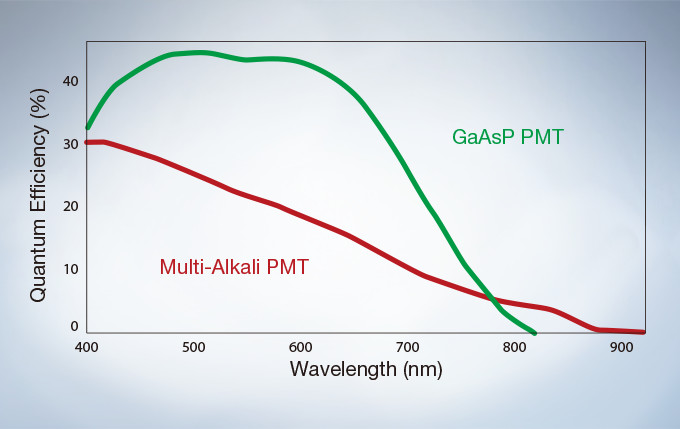
Enhanced Quantum Efficiency
The GaAsP Photomultiplier Tubes (PMTs) in the FV3000’s high sensitivity detector (HSD) enable users to view samples whose emission is too weak to view with conventional detection methods. The GaAsP PMT unit incorporates two channels with a maximum quantum efficiency of 45%, and Peltier cooling that reduces background noise by 20% for high S/N ratio images under very low excitation light.
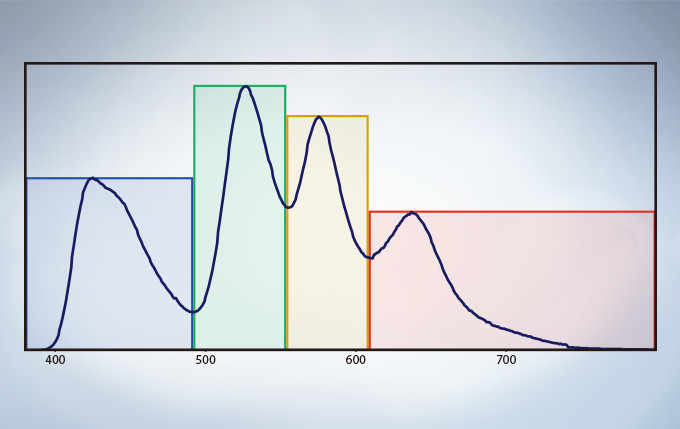
Multichannel TruSpectral Detection with Sixteen-Channel Unmixing
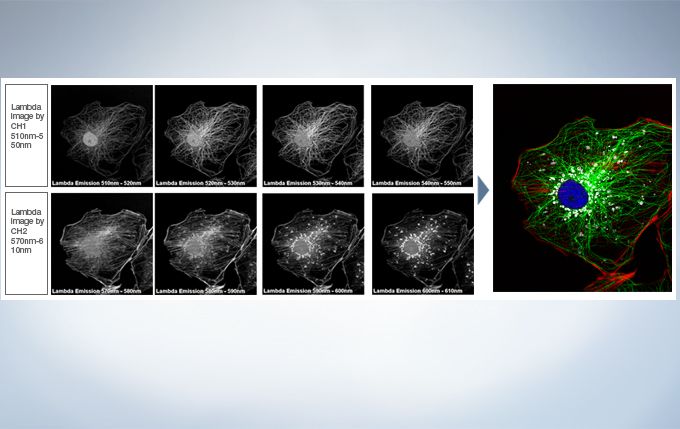
TruSpectral technology’s efficient design and software enable spectral detectors to run in multichannel mode for both live and post-processing spectral unmixing with a multichannel lambda mode. The multichannel mode facilitates constant spectral unmixing during live cell experiments, separating complex fluorescence during acquisition. With up to four different dynamic ranges from the four different channels of array, bright and dim spectral signals can be separated by independently adjusting the sensitivity of each detector.
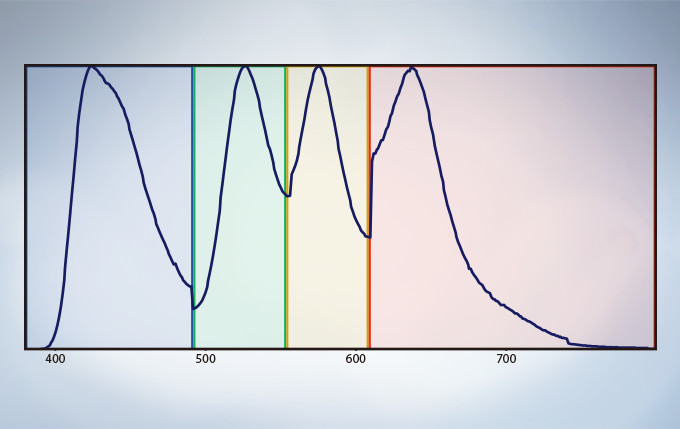
Spectral Unmixing
The deconvolution algorithm enables overlapping spectra to be separated based on the spectral information from lambda stack images. The fluorescence cross-talk between the channels can be eliminated by the unmixing algorithm during both image acquisition and post acquisition processing.
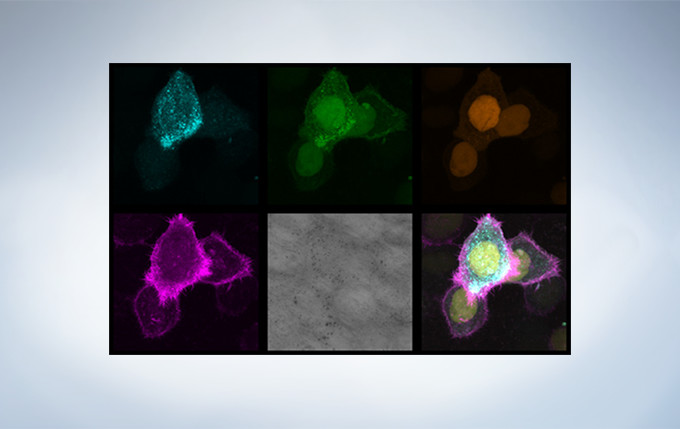
Live Spectral Unmixing with TruSpectral Detection and Real-Time Processing
The power of TruSpectral detection plus multichannel mode means live spectral unmixing can be performed during image acquisition. Complex, overlapping spectra can be processed in real time.
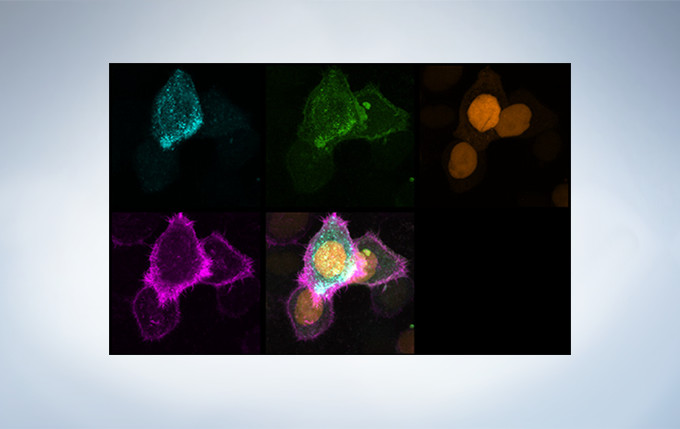
Live image before unmixing of CFP (endosomes, blue), mAmetrine (plasma membrane, green), mKO (nucleus, orange) and mKeima (F-actin, purple) during time-lapse imaging. Image data courtesy of Dr. Kazuhiro Aoki, Dr. Michiyuki Matsuda, Graduate School of Medicine, Kyoto Uni
Live blind unmixed image. Image data courtesy of Dr. Kazuhiro Aoki, Dr. Michiyuki Matsuda, Graduate School of Medicine, Kyoto Un
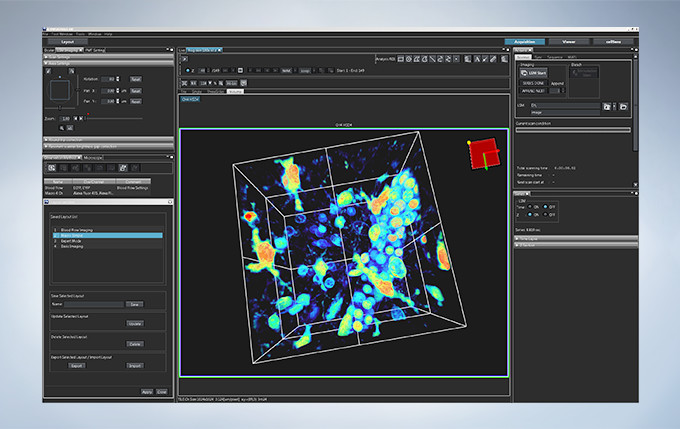
Live 3D Rendering
See your data unfold in real time with the live 3D image display function of the FV3000 software. 3D images can be constructed during image acquisition and shown as live images.
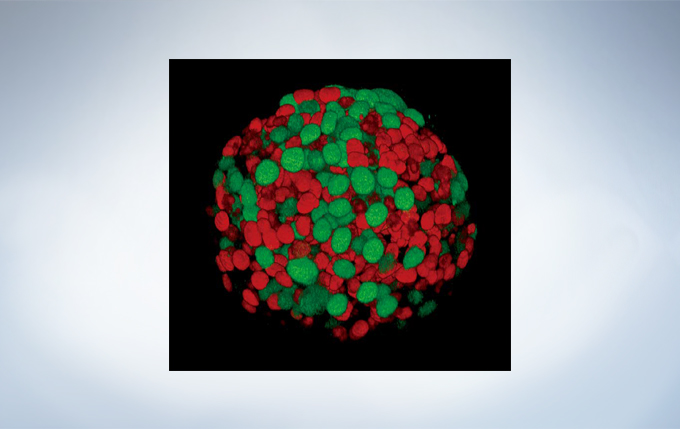
Fucci induced Spheroid of HT29 cell line Yuji Mishima, Ph.D., Kiyohiko Hatake M.D., Ph.D. Clinical Chemotherapy, Cancer Chemotherapy Center, Japanese Foundation for Cancer Research.
Macro to Micro Imaging and Super Resolution
Macro to Micro Observation
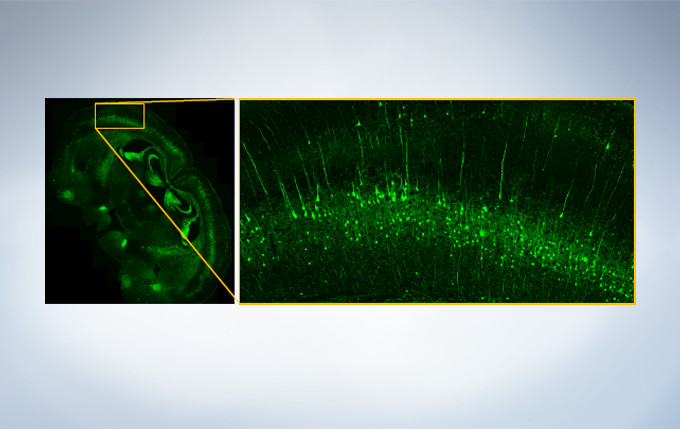
Finding areas of interest in samples can be challenging. The confocal optical design of the FV3000 series supports macro to micro imaging from 1.25X up to 150X, so users can quickly switch from low magnification overview observation to high-magnification, detailed observation of regions of interest. Users can employ image stitching at both macro and micro levels to generate overview images that show samples in context.
A stitched image of a coronal section (30 μm thickness) from an adult YFP-H mouse cerebrum acquired with 20X objective (UPLSAPO20X). Image data courtesy of Takako Kogure and Atsushi Miyawaki, Cell Function Dynamics, Brain Science Institute of RIKEN.
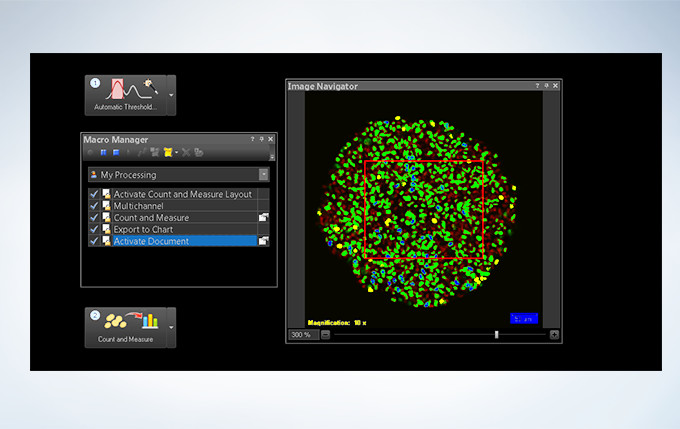
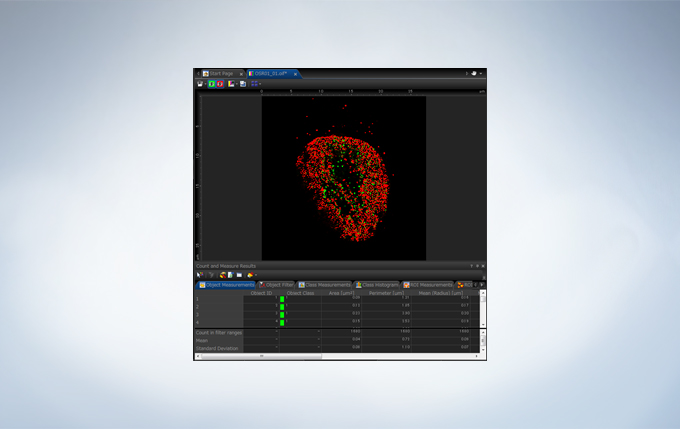
Powerful One-Click Macro Analysis with cellSens
Images alone are not enough; with integrated cellSens Count and Measure analysis, the FV3000 Series can optimize images with deconvolution and analyze them with one-click macro functionality for a broad range of morphological measurements.
A spheroid image of a NMuMG cell line expressing Fucci2. Image data courtesy of Atsushi Miyawaki, Cell Function Dynamics, Brain Science Institute of RIKEN.
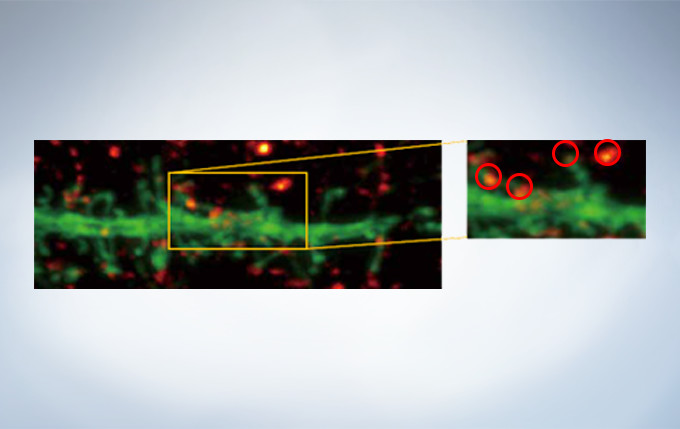
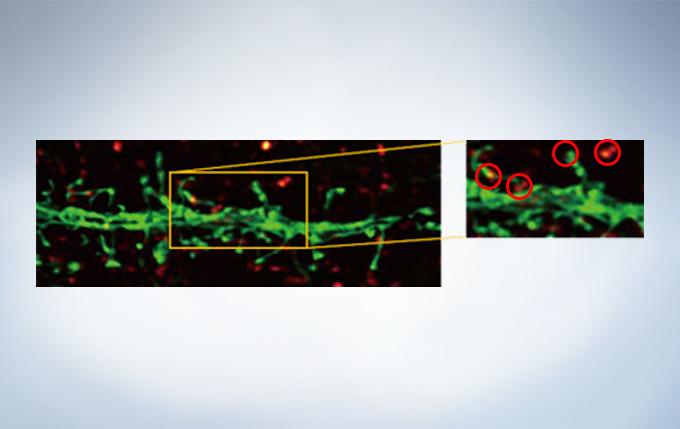
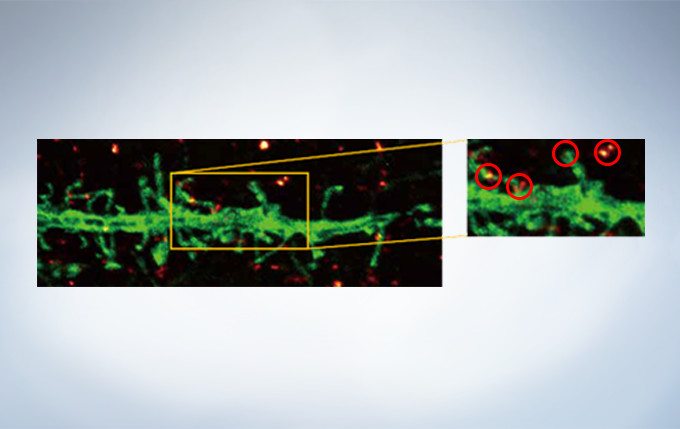
Olympus’ widely applicable super resolution method requires no special fluorophores and works for a wide range of samples. Ideal for colocalization analysis, the Olympus Super Resolution imaging module can acquire four fluorescent signals either sequentially or simultaneously with a resolution of approximately 120 nm*, nearly doubling the resolution of typical confocal microscopy. The imaging module is easy to use with minimal user training and can be added to any confocal system, making it a truly accessible method for achieving super resolution.
* Subject to objective magnification, numerical aperture, excitation and emission wavelength, and experiment conditions.
Secondary antibody labels against GFP (Alexa Fluor 488, neurons) and SV2 (Alexa Fluor 565, red). Sample courtesy of Dr. Ed Boyden and Dr. Fei Chen, MIT.
0.5 AU Confocal Image
0.5 AU Confocal Image Deconvolved with cellSens Advanced Deconvolution
Olympus Super Resolution Plus cellSens Advanced Deconvolution. Note clear separation of punctate stains with OSR.
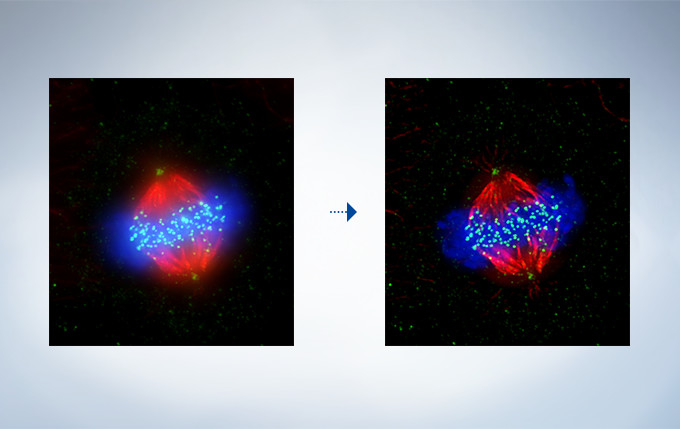
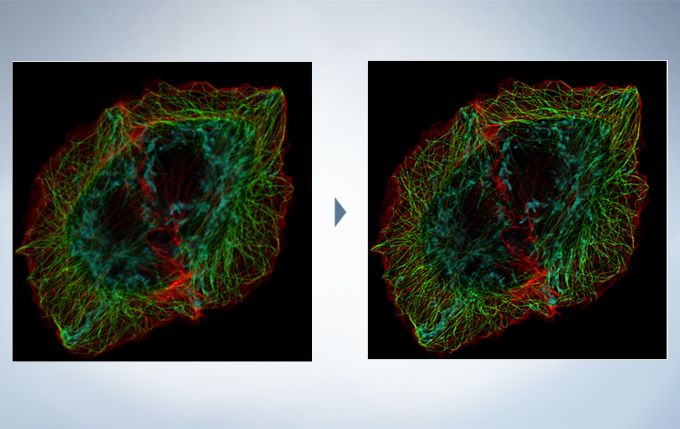
Deconvolution
The optional constrained iterative deconvolution function improves the resolution, contrast, and dynamic ranges of confocal images obtained by the FV3000. The deconvolution function can be combined with Olympus Super Resolution (FV-OSR) to improve the z-axis resolution of the deconvolved images.
(Left) Original Image, (Right) Deconvolved Image
Cell line: HeLa (human cervical cancer cell line) Immunostaining: Hec1 staining (green, Alexa Fluor 488), α-tubulin staining (red, Alexa Fluor 568),DAPI staining (blue) Mitotic spindle and kinetochores are stained with anti-α-tubulin (red) and anti-Hec1 (green) antibodies, respectively. Chromosomes interact with microtubules of the mitotic spindle via kinetochores (protein structures assembled on the centromere region of chromosomes.) Image data courtesy of Masanori Ikeda and Kozo Tanaka, Department of Molecular Oncology, Institute of Development, Aging and Cancer, Tohoku University.
COS7 cells, triple staining, DAPI (cyan), Actin Bodipy-FL(green), Tubulin AF568 (red) Image data courtesy of J. Doehner and U. Ziegler, Center for Image Analysis and Microscopy, University of Zurich
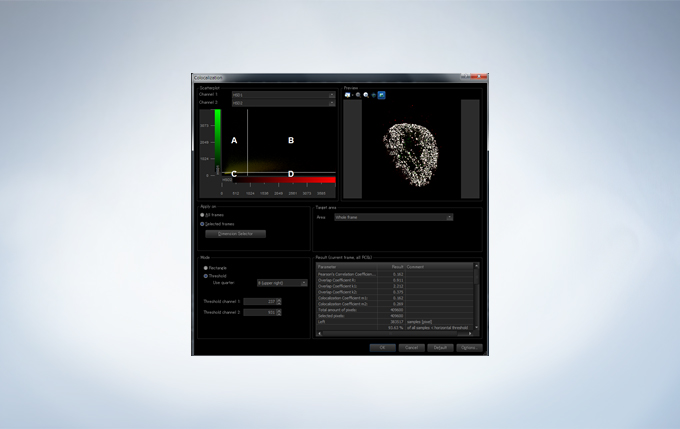
Image Analysis
The FV3000 incorporates various optional analysis functions to complete the workflow from image acquisition through data analysis. The Count and Measure solution enables the measurement of the number, size, luminosity, and morphology of the segments. Colocalization enables the analysis of overlapping fluorescent spectra.
Increase Productivity with High Speed Imaging
Galvanometer and Hybrid Galvo/Resonant Scanner
Users have their choice of two different types of scan units: galvanometer only with the FV3000 or hybrid galvanometer/resonant with the FV3000RS. The hybrid scan unit has a galvanometer scanner for high-precision scanning, as well as a resonant scanner that is ideal for high-speed imaging. With the galvanometer scanner and Olympus super resolution technology (FV-OSR), users can obtain resolutions down to 120nm with a high signal-to-noise ratio. The galvanometer scanner also features flexible scanning options, including precise tornado scanning as well as multipoint stimulation with 100ms switching time. The galvanometer scanner can image up to 16 frames per second. By switching to the resonant scanner, users can capture 30 frames per second with a full field of view at 512 x 512 pixels. By clipping down to 512 x 32 pixels, the resonant scanner can capture up to 438 frames per second to capture critical live physiological events such as calcium ion flux.
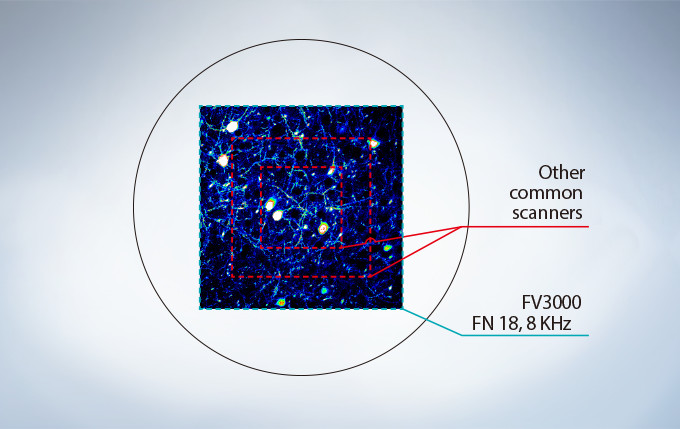
No Compromise between Speed and Field of View
Many high-speed scanning methods restrict the field of view, limiting their usefulness for examining large areas with multiple cells. The FV3000 series’ resonant scanner maintains a full 1X field of view, even at a video rate of 30 frames per second. B clipping the Y axis, additional speeds up to 438 frames per second can be achieved.
Most resonant scanners force a trade-off between speed and field of view. FLUOVIEW systems are optimized to maintain the field of view with even signal intensity so dynamic samples (e.g. calcium imaging) can be seen in the broad context of their cells and tissues.
The image above shows examples of the clipped fields of view required in other resonant scanning systems.
Platelets bound to a thrombosis in the blood vessel of a mouse. Images taken at 30 fps in full frame by resonant scanner with 2 CH GaAsP PMTs.
Image data courtesy of Dr. Takuya Hiratsuka, Dr. Michiyuki Matsuda, Graduate School of Biostudies, Kyoto University.
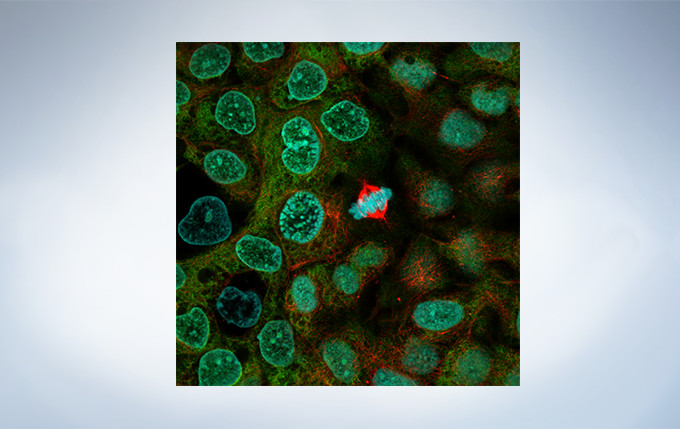
A431 cells fixed with methanol labeled with Abcam Anti-ERK1 + ERK2 antibody (Alexa Fluor 488) ab208564 and Anti-alpha Tubulin antibody (Alexa Fluor 594) ab195889 and DAPI. Sample courtesy of Abcam.
Optimized for Live Cell Imaging
Resonant scanning greatly reduces photobleaching and phototoxicity compared to standard galvanometer scans by preventing the excitation of fluorophores into triplet states that create reactive oxygen species. These features make live cell experiments more robust and reliable. The FV3000 series has complete laser intensity control from low to high range, enabling the system to use the minimum required amount of laser power on samples. The optional laser power monitor provides consistent laser power during long-term time-lapse imaging across multiple days.
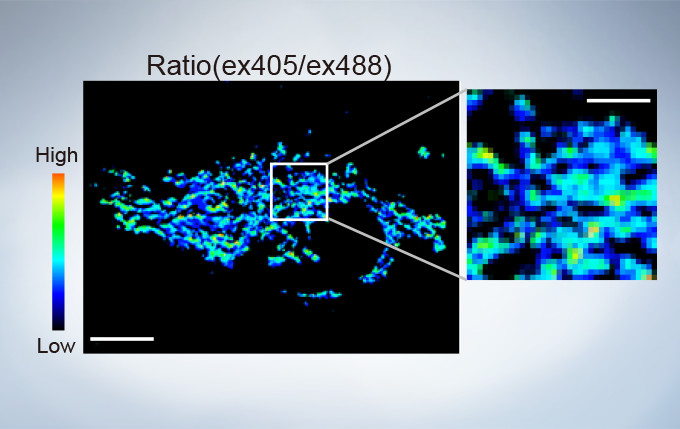
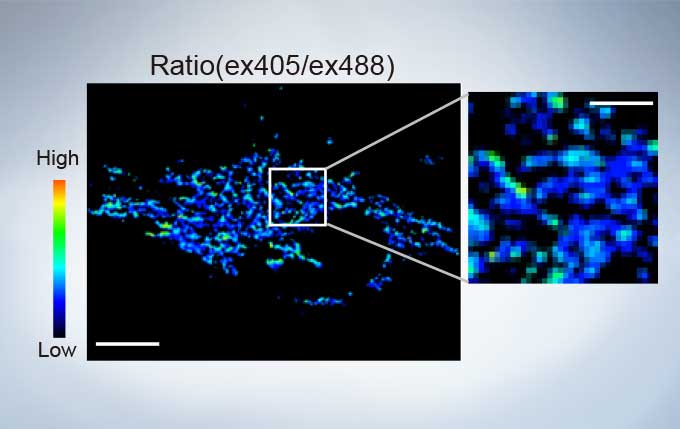
Ratio Imaging and Intensity Modulated Display (IMD)
The FV3000’s ratio imaging analysis function includes an Intensity Modulated Display (IMD) function in the software that displays quantitative fluorescence ratio changes during both standard and high-speed acquisitions. This function is particularly useful for calcium and FRET imaging where a pure ratio display provides poor contrast in background areas.
sGFP1-mito reveals heterogeneity in mitochondrial thermogenesis in HeLa cells. The images of ratio (ex 405 nm/ex 488 nm) in tsGFP1-mito-expressing cells before and after CCCP treatment at 37 °C. Scale bars indicate 10 μm (whole image) and 3 μm (inset). Image data courtesy of Shigeki Kiyonaka Ph,D, Yasuo Mori Ph,D Molecular Biology Field, Department of Synthetic Chemistry and Biological Chemistry, Kyoto University.
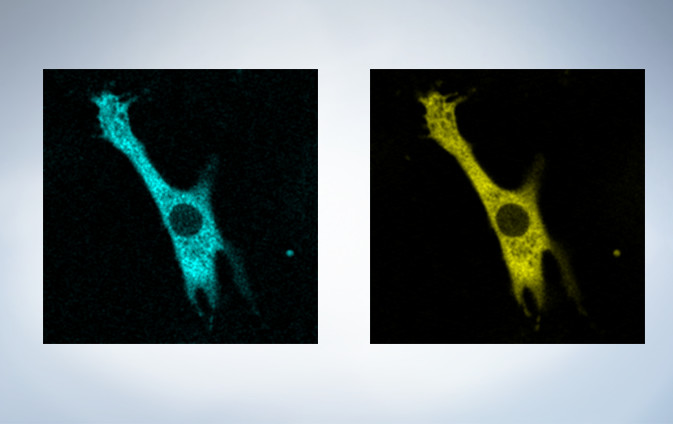
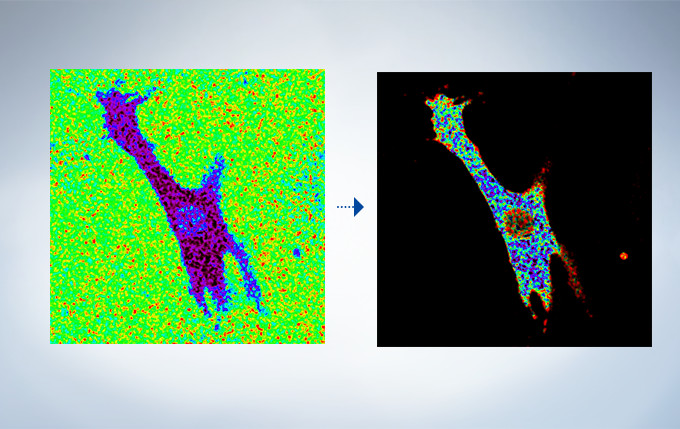
(Left) CFP, (Right) YFP FRET
(Left) Raw CFP/YFP ratio, (Right) IMD of CFP/YFP ratio
Cardiomyoctye Image data courtesy of Yusuke Niino and Atsushi Miyawaki, Cell Function Dynamics, Brain Science Institute of RIKEN.
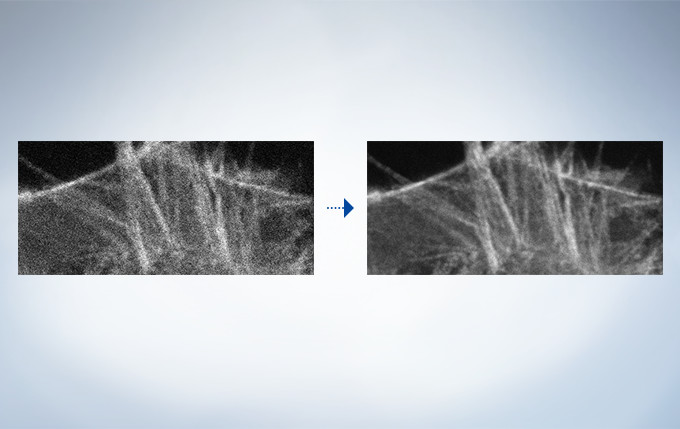
Rolling Average Processing
High-speed scanning at low laser power to avoid phototoxicity often decreases the signal-to-noise ratio. With rolling average post-processing, users have the flexibility to adjust high-speed time-lapse images while maintaining the time scale and keeping the original data.
(Left) Raw 30 fps data acquired at low laser power (0.05%, 488 nm). (Right) Rolling average processing (10 frame) on 30 fps data acquired at low laser power.
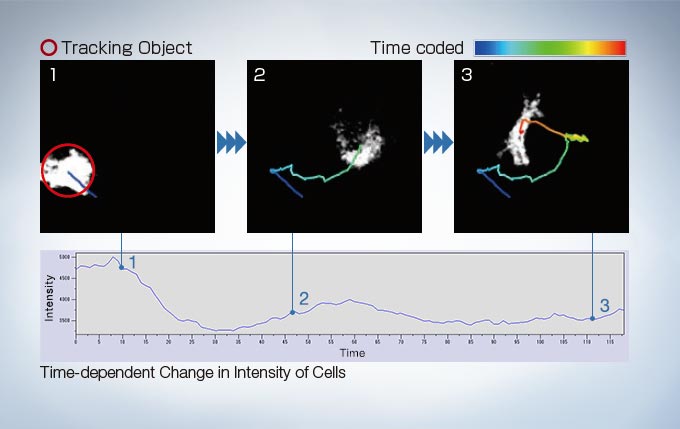
Object Tracking
In time-lapse imaging, moving objects can be automatically detected, tracked, and analyzed. cellSens software’s tracking function provides a powerful and intuitive tool to quantify dynamic processes such as cell movement and division.
Bioluminescence of RA-induced differentiating cells at day 12 from Bmal1:luc stably transfected ES cells Image data courtesy of: Kazuhiro Yagita, M.D. Ph.D. Department of Physiology and Systems Bioscience, Kyoto Prefectural University of Medicine Reference: Proc Natl Acad Sci U S A. 107(8): 3846–3851(2010)
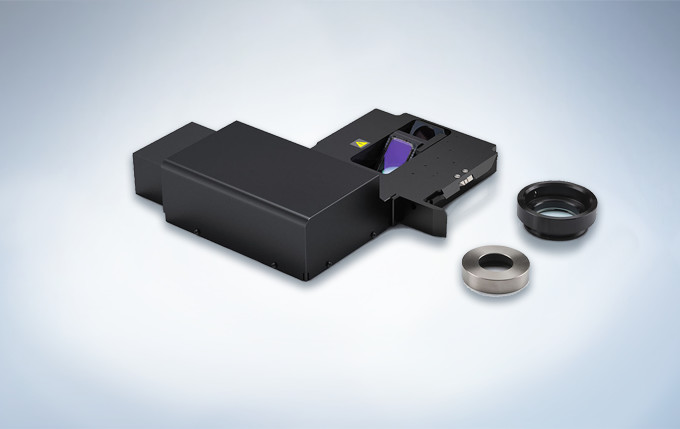
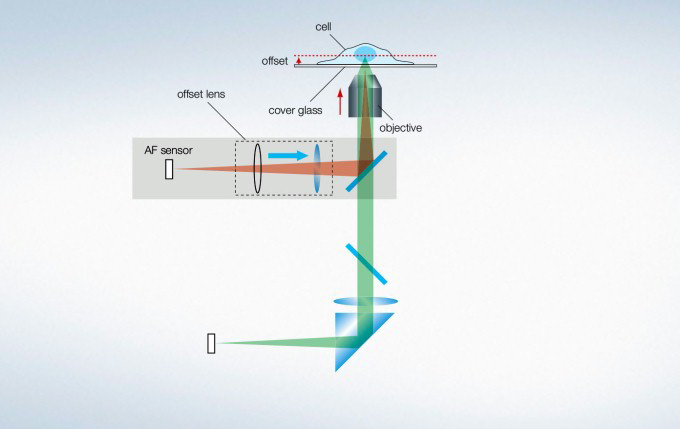
Maintain Focus with Z-Drift Compensation (ZDC) System
The IX3-ZDC2 Z-drift compensator uses minimally-phototoxic infrared light (laser class 1) to identify the location of the sample plane. One-shot autofocus (AF) mode enables several focus positions to be set as desired for deeper samples, enabling efficient Z-stack acquisitions in multiposition experiments. The continuous AF mode keeps the desired plane of observation precisely in focus, avoiding focus drift due to temperature changes or the addition of reagents, making it ideal for measurements that require more stringent focusing. Furthermore, the increased optical offset enables continuous AF with plastic vessels or with dry objectives. The Z-drift compensator is also compatible with silicone objectives (in AF mode).
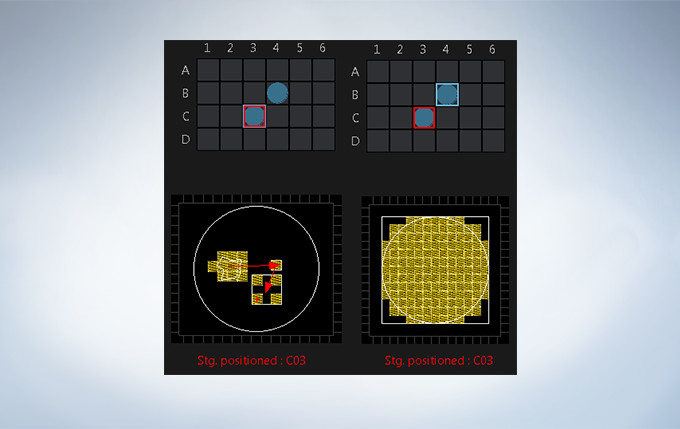
Stage Control for Multi-Area Time-lapse, Microplate, and Stitching
Multi-area time-lapse and stitching provide robust and accurate time-lapse data, and enable users to generate detailed overview images to see their data in context. The well navigator function provides sophisticated, intuitive controls for a wide range of cell culture vessels and custom plates.
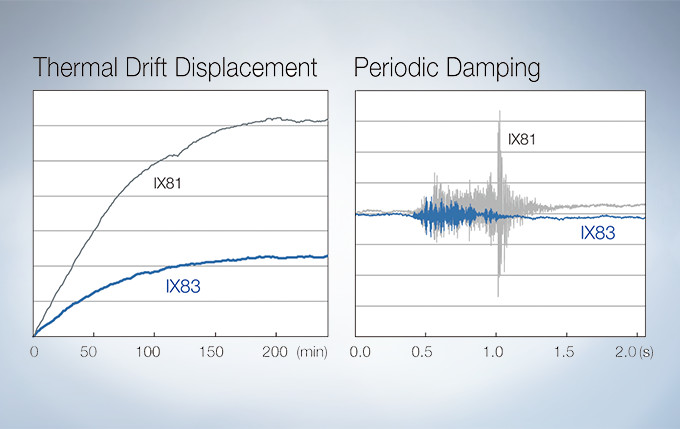
Stable Time-Lapse Imaging with the IX83 Microscope
A Z-drive guide installed near the revolving nosepiece combines high thermal rigidity with the stability of a wraparound structure to significantly reduce the impact of heat and vibration and improve the quality of time-lapse imaging.
Hard Disk Recording
The microscope comes equipped with a hard-disk drive (HDD) recording function. The images are stored automatically in the HDD. Large volumes of data, such as those obtained from long-term time-lapse imaging, can be easily collected.
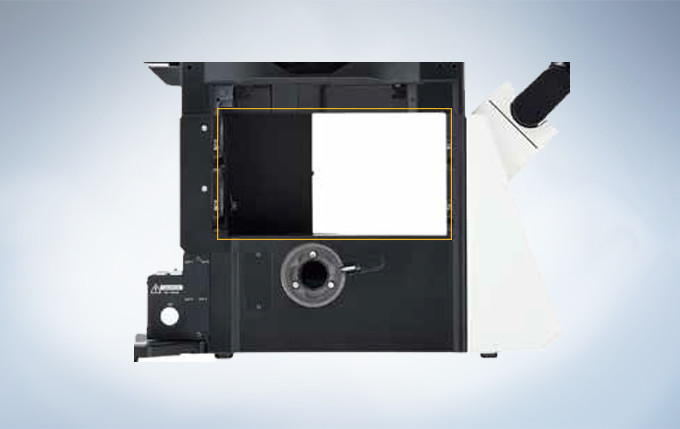
High Contrast under Bright Conditions
The umbra unit is designed specifically for fluorescence observation under bright room conditions. It efficiently blocks out room light, enhances the contrast of fluorescence, and enables clear fluorescence observation without the need for a dark room.
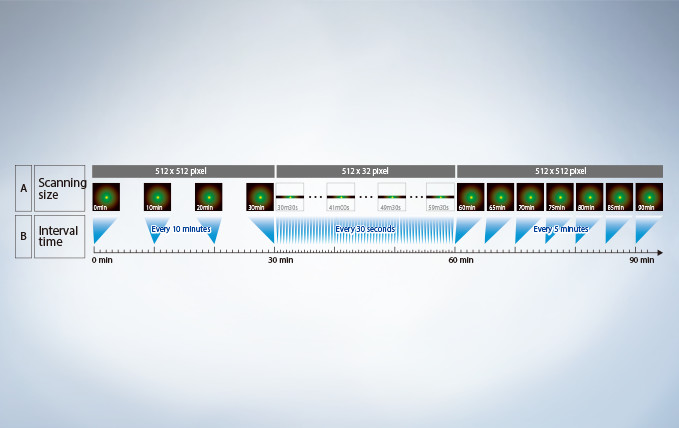
Reduce Complexity with the Sequence Manager
With the Sequence Manager software module, complex protocols are handled with ease and accurate timing. Multi-day time-lapse experiments are controlled with microsecond scan accuracy and millisecond sequence execution accuracy. Various protocols, such as time-lapse with different time intervals, switching between high and low magnification, and photo-stimulation between imaging by FRAP or FRET (acceptor photobleaching), can be performed.
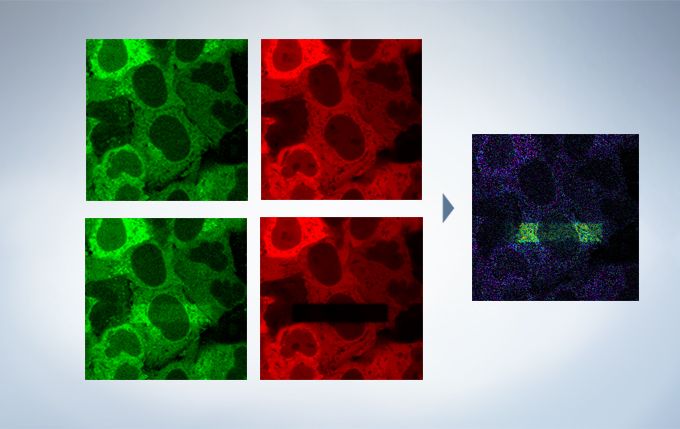
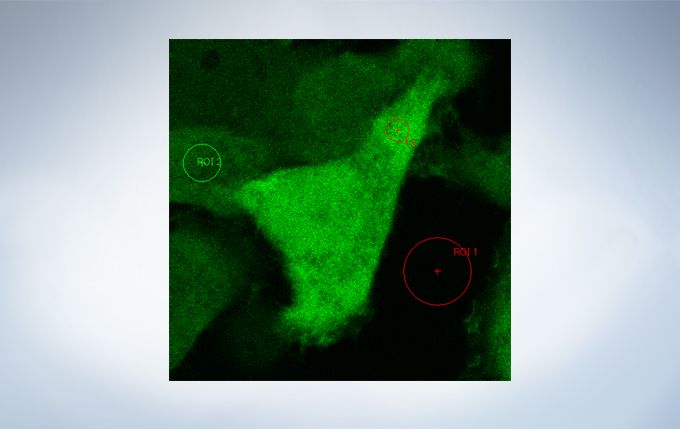
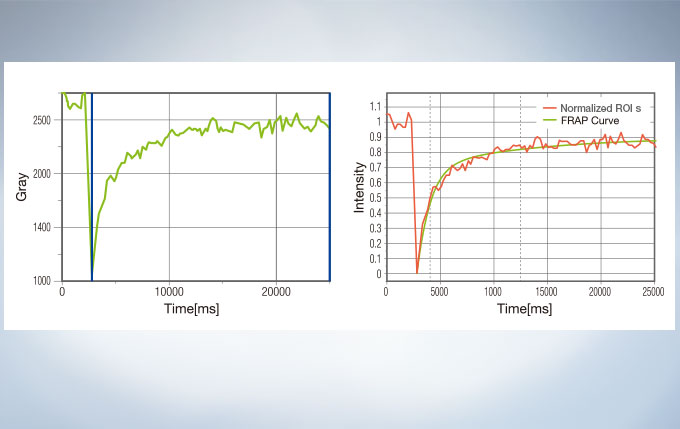
Life Science Analysis
The cellSens Life Science Analysis module enables analysis of images from FRAP or FRET experiments. In FRAP, τ/2 and the Mobile/ Immobile fraction can be estimated by fitting the curve of luminosity change caused by fluorescence recovery after bleaching. FRET enables the measurement of FRET efficiency by acceptor photobleaching, ratio imaging, and sensitized emission.
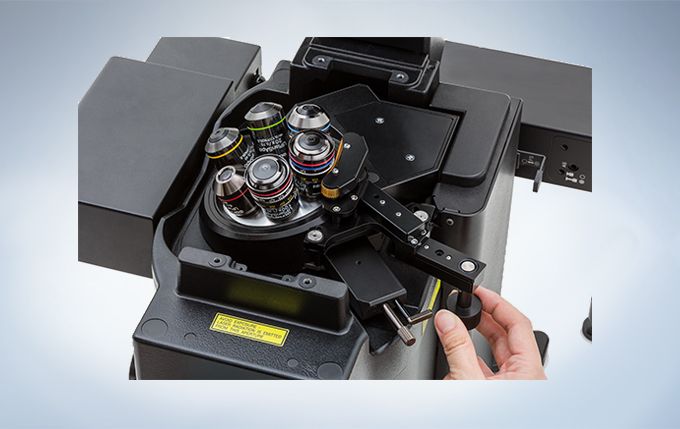
Superior Objectives
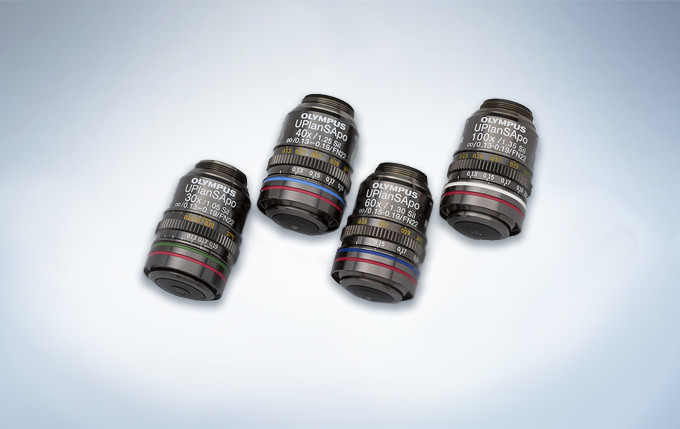
Silicone Immersion Objectives for Live Cell Imaging Deliver High-Resolution Observation at Depth
Olympus offers four high NA silicone immersion objectives that deliver excellent performance for live cell imaging. The refractive index of silicone oil (ne≈1.40) is close to that of living tissue (ne≈1.38), enabling high-resolution observations deep inside living tissue with minimal spherical aberration caused by refractive index mismatch. Silicone oil does not dry out or harden, so there is never a need to refill oil, making it ideal for extended time-lapse observations.
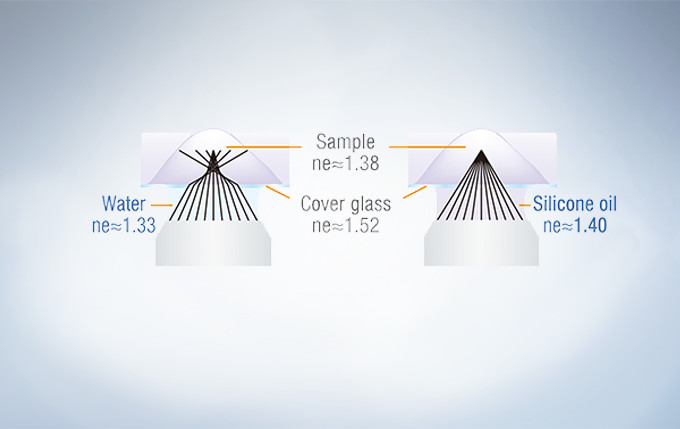
Water immersion objective (Left), Silicone immersion objective (Right)
In deep tissue observation, image quality depends on keeping the refractive index of the sample and immersion medium as close to each other as possible. When working with a silicone immersion objective, the difference between the refractive index of the samples and silicone oil is minimal, thus enabling brighter fluorescence images with higher resolution for deep tissue observation.
UPLSAPO30XS: For a broader view and greater depth
Magnification: 30X, NA: 1.05 (silicone oil immersion), W.D.: 0.8 mm,
cover glass thickness: 0.13 – 0.19 mm, operating temperature: 23 – 37 °C
UPLSAPO40XS : For a good balance between field of view and resolution
Magnification: 40X, NA: 1.25 (silicone oil immersion), W.D.: 0.3 mm,
cover glass thickness: 0.13 – 0.19 mm, operating temperature: 23 – 37 °C
UPLSAPO60XS2: For 3D observations with superior resolution
Magnification: 60X, NA: 1.30 (silicone oil immersion), W.D.: 0.3 mm,
cover glass thickness: 0.15 – 0.19 mm, operating temperature: 23 – 37 °C
UPLSAPO100XS: For greater brightness at depth in closely defined regions
Magnification: 100X, NA: 1.35 (silicone oil immersion), W.D.: 0.2 mm, cover glass thickness: 0.13 – 0.19 mm, operating temperature: 23 – 37 °C
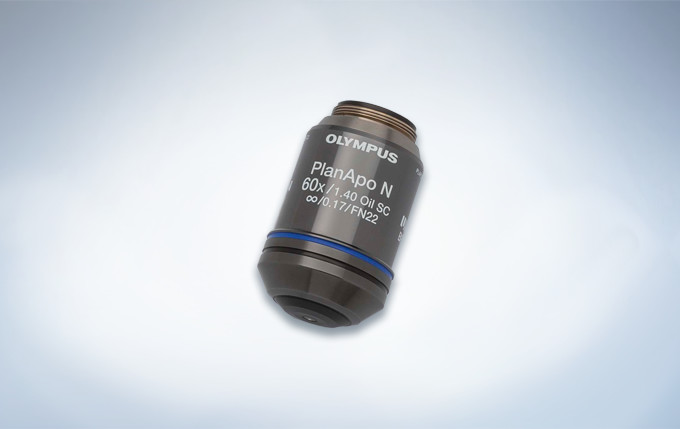
PLAPON60XOSC2: Enhance the Reliability of Colocalization Analysis with a Low Chromatic Aberration Objective
This oil immersion objective minimizes lateral and axial chromatic aberration in the 405–650 nm spectrum. Colocalization images are acquired reliably and images are measured with superior positional accuracy. The objective also compensates for chromatic aberration through near infrared up to 850 nm, making it the ideal choice for quantitative imaging.
Low Chromatic Aberration Objective Magnification: 60X NA: 1.4 (oil immersion) W.D.: 0.12 mm Chromatic aberration compensation range: 405 – 650 nm Optical data provided for each objective.
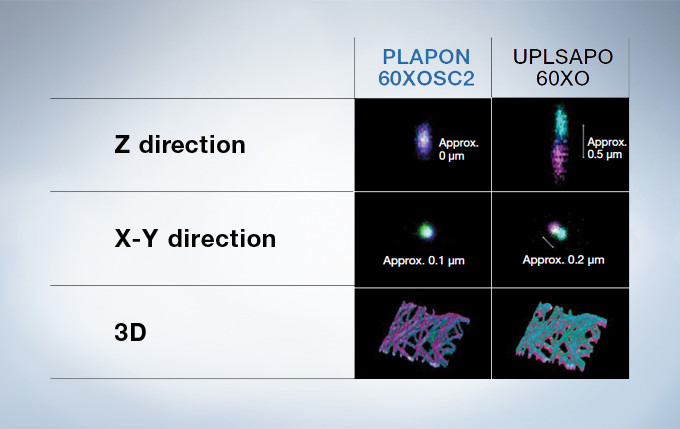
Performance Comparison of the PLAPON60XOSC2 and the UPLSAPO60XO
Reduce Spherical Aberration
The correction collar adjusts the lens position of objectives to correct the spherical aberration caused by refractive index mismatch, resulting in the improvement of image quality, such as resolution, brightness and contrast. The correction collar is especially necessary for objectives with high NA when they are used for super resolution imaging, because they are greatly affected by spherical aberration. The remote correction collar unit is useful for easy adjustment and improvement of the image quality, and operable on all UIS2 objectives which have a correction collar.
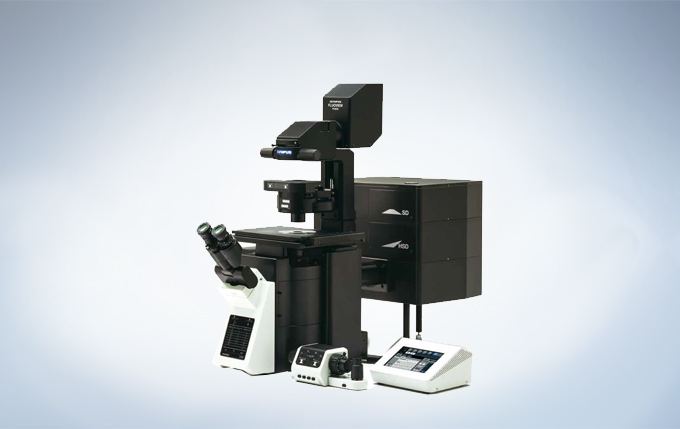
Choose the Frame That Suits Your Application
Inverted microscope
Suitable for observing cells cultured in a vessel.
The Z-drift compensator enables time-lapse observations that remain in focus.
Maintain the environmental conditions of cultured cells by adding a stage-top or full enclosure incubator.
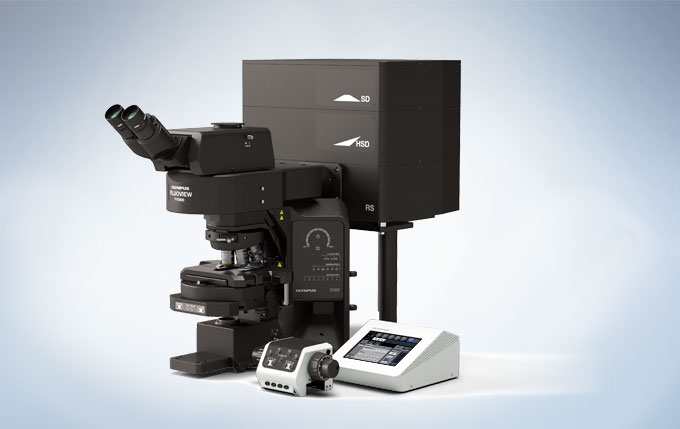
Upright microscope (configured for imaging)
Optimized for fixed tissue and glass slide specimens.
Motorized 7-position nosepiece and condenser enable automated transitions from low to high magnification.
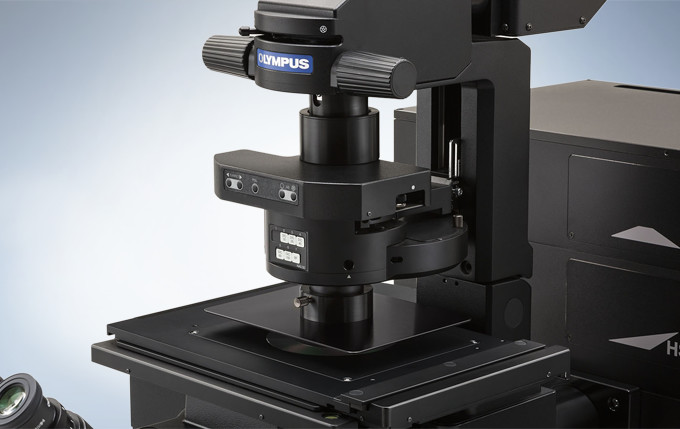
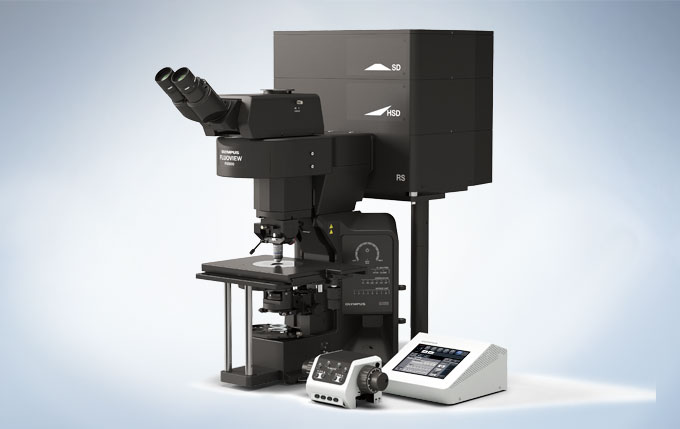
Upright microscope (configured for electrophysiology)
Ample space around the objectives enables patch-clamp devices to be installed.
Add additional space by lowering the stage position for experiments that require large sample handling.
Swing and slider nosepieces are available so objectives can be easily changed without interfering with the patch-clamp set-up.
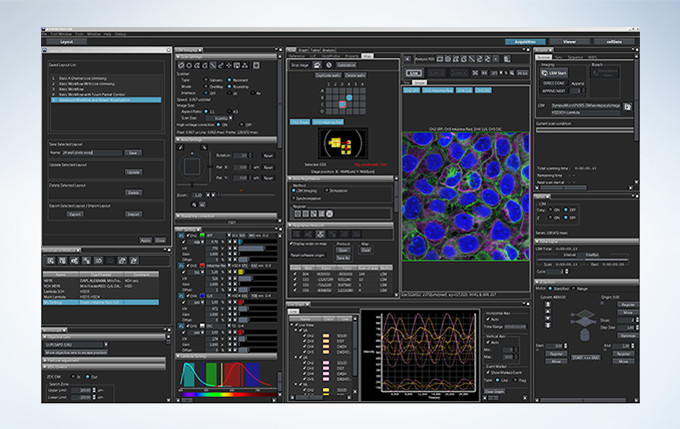
Intuitive Software
Customizable and saveable layouts make it easy to tailor the interface to your workflow and experiment needs, from basic to complex.
Layout
Start by selecting your preferred display with specific tools for basic to complex acquisition.
Acquisition Condition
Reload settings that were ideal for your last experiment to provide consistency.
Acquisition
Activate basic to complex acquisitions with live ratio, intensity modulated display, quantitative region of interest (ROI) graphing or spectral unmixing display, and data backup for added security.
Viewer
Review data as it is generated. Generate 3D and 4D views and animations to explore and share data in depth.
Analysis
Extract data from images using online or offline processing. Analytical tools include Olympus super resolution technology (FV-OSR) and powerful cellSens software with features such as deconvolution, filtering, count and measure, and one-click macros.